Propeller BlocklyProp Block Reference
-
4×4 Keypad Wiring & Example Code
- 4×4 Keypad Wiring & Example Code
- About Naming Things
- Air Quality BME680
- Badge Display
- 4 x 4 Keypad
- ColorPal Wiring & Code Example
- Sound Impact Wiring & Example Code
- GPS Wiring & Example Code
- PIR Wiring & Example Code
- About BlocklyProp Updates
- Badge LEDs
- Badge Lock
- Joystick Wiring & Example Code
- Fingerprint Scanner Wiring & Example Code
- About Multicore
- Temperature & Humidity Sensor Wiring & Example Code
- Memsic 2125 Wiring & Example Code
- GPS
- System
- Badge Buttons
- PING))) Wiring & Example Code
- RFID Wiring & Example Code
- Graph
- Temp & Humidity
- BlocklyProp Bulk Project Download
- About Board Types
- LIS3DH Accelerometer
- ePaper
- IR Remote Wiring & Example Code
- Fingerprint Scanner
- Arrays
- Advanced WX
- Simple WX
- WX WiFi
- RGB LEDs
- LSM9DS1 9-axis IMU
- Robot
- PWM
- Pulse in / out
- Voltage
- RC time
- Servo
- Audio
- Analog / Pulses
- Memory
- ColorPal
- Sound Impact Sensor
- Sony Remote
- RFID
- PIR
- Ping))) Distance
- MMA7455
- Memsic 2-axis
- 2-Axis Joystick
- HMC5883L
- Sensor
- XBee
- Protocols
- Terminal
- OLED
- Serial LCD
- Communicate
- Pin states
- Functions
- Variables
- Values
- Strings
- Numbers
- Operators
- Control
-
About Naming Things
- 4×4 Keypad Wiring & Example Code
- About Naming Things
- Air Quality BME680
- Badge Display
- 4 x 4 Keypad
- ColorPal Wiring & Code Example
- Sound Impact Wiring & Example Code
- GPS Wiring & Example Code
- PIR Wiring & Example Code
- About BlocklyProp Updates
- Badge LEDs
- Badge Lock
- Joystick Wiring & Example Code
- Fingerprint Scanner Wiring & Example Code
- About Multicore
- Temperature & Humidity Sensor Wiring & Example Code
- Memsic 2125 Wiring & Example Code
- GPS
- System
- Badge Buttons
- PING))) Wiring & Example Code
- RFID Wiring & Example Code
- Graph
- Temp & Humidity
- BlocklyProp Bulk Project Download
- About Board Types
- LIS3DH Accelerometer
- ePaper
- IR Remote Wiring & Example Code
- Fingerprint Scanner
- Arrays
- Advanced WX
- Simple WX
- WX WiFi
- RGB LEDs
- LSM9DS1 9-axis IMU
- Robot
- PWM
- Pulse in / out
- Voltage
- RC time
- Servo
- Audio
- Analog / Pulses
- Memory
- ColorPal
- Sound Impact Sensor
- Sony Remote
- RFID
- PIR
- Ping))) Distance
- MMA7455
- Memsic 2-axis
- 2-Axis Joystick
- HMC5883L
- Sensor
- XBee
- Protocols
- Terminal
- OLED
- Serial LCD
- Communicate
- Pin states
- Functions
- Variables
- Values
- Strings
- Numbers
- Operators
- Control
-
Air Quality BME680
- 4×4 Keypad Wiring & Example Code
- About Naming Things
- Air Quality BME680
- Badge Display
- 4 x 4 Keypad
- ColorPal Wiring & Code Example
- Sound Impact Wiring & Example Code
- GPS Wiring & Example Code
- PIR Wiring & Example Code
- About BlocklyProp Updates
- Badge LEDs
- Badge Lock
- Joystick Wiring & Example Code
- Fingerprint Scanner Wiring & Example Code
- About Multicore
- Temperature & Humidity Sensor Wiring & Example Code
- Memsic 2125 Wiring & Example Code
- GPS
- System
- Badge Buttons
- PING))) Wiring & Example Code
- RFID Wiring & Example Code
- Graph
- Temp & Humidity
- BlocklyProp Bulk Project Download
- About Board Types
- LIS3DH Accelerometer
- ePaper
- IR Remote Wiring & Example Code
- Fingerprint Scanner
- Arrays
- Advanced WX
- Simple WX
- WX WiFi
- RGB LEDs
- LSM9DS1 9-axis IMU
- Robot
- PWM
- Pulse in / out
- Voltage
- RC time
- Servo
- Audio
- Analog / Pulses
- Memory
- ColorPal
- Sound Impact Sensor
- Sony Remote
- RFID
- PIR
- Ping))) Distance
- MMA7455
- Memsic 2-axis
- 2-Axis Joystick
- HMC5883L
- Sensor
- XBee
- Protocols
- Terminal
- OLED
- Serial LCD
- Communicate
- Pin states
- Functions
- Variables
- Values
- Strings
- Numbers
- Operators
- Control
-
Badge Display
- 4×4 Keypad Wiring & Example Code
- About Naming Things
- Air Quality BME680
- Badge Display
- 4 x 4 Keypad
- ColorPal Wiring & Code Example
- Sound Impact Wiring & Example Code
- GPS Wiring & Example Code
- PIR Wiring & Example Code
- About BlocklyProp Updates
- Badge LEDs
- Badge Lock
- Joystick Wiring & Example Code
- Fingerprint Scanner Wiring & Example Code
- About Multicore
- Temperature & Humidity Sensor Wiring & Example Code
- Memsic 2125 Wiring & Example Code
- GPS
- System
- Badge Buttons
- PING))) Wiring & Example Code
- RFID Wiring & Example Code
- Graph
- Temp & Humidity
- BlocklyProp Bulk Project Download
- About Board Types
- LIS3DH Accelerometer
- ePaper
- IR Remote Wiring & Example Code
- Fingerprint Scanner
- Arrays
- Advanced WX
- Simple WX
- WX WiFi
- RGB LEDs
- LSM9DS1 9-axis IMU
- Robot
- PWM
- Pulse in / out
- Voltage
- RC time
- Servo
- Audio
- Analog / Pulses
- Memory
- ColorPal
- Sound Impact Sensor
- Sony Remote
- RFID
- PIR
- Ping))) Distance
- MMA7455
- Memsic 2-axis
- 2-Axis Joystick
- HMC5883L
- Sensor
- XBee
- Protocols
- Terminal
- OLED
- Serial LCD
- Communicate
- Pin states
- Functions
- Variables
- Values
- Strings
- Numbers
- Operators
- Control
-
4 x 4 Keypad
- 4×4 Keypad Wiring & Example Code
- About Naming Things
- Air Quality BME680
- Badge Display
- 4 x 4 Keypad
- ColorPal Wiring & Code Example
- Sound Impact Wiring & Example Code
- GPS Wiring & Example Code
- PIR Wiring & Example Code
- About BlocklyProp Updates
- Badge LEDs
- Badge Lock
- Joystick Wiring & Example Code
- Fingerprint Scanner Wiring & Example Code
- About Multicore
- Temperature & Humidity Sensor Wiring & Example Code
- Memsic 2125 Wiring & Example Code
- GPS
- System
- Badge Buttons
- PING))) Wiring & Example Code
- RFID Wiring & Example Code
- Graph
- Temp & Humidity
- BlocklyProp Bulk Project Download
- About Board Types
- LIS3DH Accelerometer
- ePaper
- IR Remote Wiring & Example Code
- Fingerprint Scanner
- Arrays
- Advanced WX
- Simple WX
- WX WiFi
- RGB LEDs
- LSM9DS1 9-axis IMU
- Robot
- PWM
- Pulse in / out
- Voltage
- RC time
- Servo
- Audio
- Analog / Pulses
- Memory
- ColorPal
- Sound Impact Sensor
- Sony Remote
- RFID
- PIR
- Ping))) Distance
- MMA7455
- Memsic 2-axis
- 2-Axis Joystick
- HMC5883L
- Sensor
- XBee
- Protocols
- Terminal
- OLED
- Serial LCD
- Communicate
- Pin states
- Functions
- Variables
- Values
- Strings
- Numbers
- Operators
- Control
-
ColorPal Wiring & Code Example
- 4×4 Keypad Wiring & Example Code
- About Naming Things
- Air Quality BME680
- Badge Display
- 4 x 4 Keypad
- ColorPal Wiring & Code Example
- Sound Impact Wiring & Example Code
- GPS Wiring & Example Code
- PIR Wiring & Example Code
- About BlocklyProp Updates
- Badge LEDs
- Badge Lock
- Joystick Wiring & Example Code
- Fingerprint Scanner Wiring & Example Code
- About Multicore
- Temperature & Humidity Sensor Wiring & Example Code
- Memsic 2125 Wiring & Example Code
- GPS
- System
- Badge Buttons
- PING))) Wiring & Example Code
- RFID Wiring & Example Code
- Graph
- Temp & Humidity
- BlocklyProp Bulk Project Download
- About Board Types
- LIS3DH Accelerometer
- ePaper
- IR Remote Wiring & Example Code
- Fingerprint Scanner
- Arrays
- Advanced WX
- Simple WX
- WX WiFi
- RGB LEDs
- LSM9DS1 9-axis IMU
- Robot
- PWM
- Pulse in / out
- Voltage
- RC time
- Servo
- Audio
- Analog / Pulses
- Memory
- ColorPal
- Sound Impact Sensor
- Sony Remote
- RFID
- PIR
- Ping))) Distance
- MMA7455
- Memsic 2-axis
- 2-Axis Joystick
- HMC5883L
- Sensor
- XBee
- Protocols
- Terminal
- OLED
- Serial LCD
- Communicate
- Pin states
- Functions
- Variables
- Values
- Strings
- Numbers
- Operators
- Control
-
Sound Impact Wiring & Example Code
- 4×4 Keypad Wiring & Example Code
- About Naming Things
- Air Quality BME680
- Badge Display
- 4 x 4 Keypad
- ColorPal Wiring & Code Example
- Sound Impact Wiring & Example Code
- GPS Wiring & Example Code
- PIR Wiring & Example Code
- About BlocklyProp Updates
- Badge LEDs
- Badge Lock
- Joystick Wiring & Example Code
- Fingerprint Scanner Wiring & Example Code
- About Multicore
- Temperature & Humidity Sensor Wiring & Example Code
- Memsic 2125 Wiring & Example Code
- GPS
- System
- Badge Buttons
- PING))) Wiring & Example Code
- RFID Wiring & Example Code
- Graph
- Temp & Humidity
- BlocklyProp Bulk Project Download
- About Board Types
- LIS3DH Accelerometer
- ePaper
- IR Remote Wiring & Example Code
- Fingerprint Scanner
- Arrays
- Advanced WX
- Simple WX
- WX WiFi
- RGB LEDs
- LSM9DS1 9-axis IMU
- Robot
- PWM
- Pulse in / out
- Voltage
- RC time
- Servo
- Audio
- Analog / Pulses
- Memory
- ColorPal
- Sound Impact Sensor
- Sony Remote
- RFID
- PIR
- Ping))) Distance
- MMA7455
- Memsic 2-axis
- 2-Axis Joystick
- HMC5883L
- Sensor
- XBee
- Protocols
- Terminal
- OLED
- Serial LCD
- Communicate
- Pin states
- Functions
- Variables
- Values
- Strings
- Numbers
- Operators
- Control
-
GPS Wiring & Example Code
- 4×4 Keypad Wiring & Example Code
- About Naming Things
- Air Quality BME680
- Badge Display
- 4 x 4 Keypad
- ColorPal Wiring & Code Example
- Sound Impact Wiring & Example Code
- GPS Wiring & Example Code
- PIR Wiring & Example Code
- About BlocklyProp Updates
- Badge LEDs
- Badge Lock
- Joystick Wiring & Example Code
- Fingerprint Scanner Wiring & Example Code
- About Multicore
- Temperature & Humidity Sensor Wiring & Example Code
- Memsic 2125 Wiring & Example Code
- GPS
- System
- Badge Buttons
- PING))) Wiring & Example Code
- RFID Wiring & Example Code
- Graph
- Temp & Humidity
- BlocklyProp Bulk Project Download
- About Board Types
- LIS3DH Accelerometer
- ePaper
- IR Remote Wiring & Example Code
- Fingerprint Scanner
- Arrays
- Advanced WX
- Simple WX
- WX WiFi
- RGB LEDs
- LSM9DS1 9-axis IMU
- Robot
- PWM
- Pulse in / out
- Voltage
- RC time
- Servo
- Audio
- Analog / Pulses
- Memory
- ColorPal
- Sound Impact Sensor
- Sony Remote
- RFID
- PIR
- Ping))) Distance
- MMA7455
- Memsic 2-axis
- 2-Axis Joystick
- HMC5883L
- Sensor
- XBee
- Protocols
- Terminal
- OLED
- Serial LCD
- Communicate
- Pin states
- Functions
- Variables
- Values
- Strings
- Numbers
- Operators
- Control
-
PIR Wiring & Example Code
- 4×4 Keypad Wiring & Example Code
- About Naming Things
- Air Quality BME680
- Badge Display
- 4 x 4 Keypad
- ColorPal Wiring & Code Example
- Sound Impact Wiring & Example Code
- GPS Wiring & Example Code
- PIR Wiring & Example Code
- About BlocklyProp Updates
- Badge LEDs
- Badge Lock
- Joystick Wiring & Example Code
- Fingerprint Scanner Wiring & Example Code
- About Multicore
- Temperature & Humidity Sensor Wiring & Example Code
- Memsic 2125 Wiring & Example Code
- GPS
- System
- Badge Buttons
- PING))) Wiring & Example Code
- RFID Wiring & Example Code
- Graph
- Temp & Humidity
- BlocklyProp Bulk Project Download
- About Board Types
- LIS3DH Accelerometer
- ePaper
- IR Remote Wiring & Example Code
- Fingerprint Scanner
- Arrays
- Advanced WX
- Simple WX
- WX WiFi
- RGB LEDs
- LSM9DS1 9-axis IMU
- Robot
- PWM
- Pulse in / out
- Voltage
- RC time
- Servo
- Audio
- Analog / Pulses
- Memory
- ColorPal
- Sound Impact Sensor
- Sony Remote
- RFID
- PIR
- Ping))) Distance
- MMA7455
- Memsic 2-axis
- 2-Axis Joystick
- HMC5883L
- Sensor
- XBee
- Protocols
- Terminal
- OLED
- Serial LCD
- Communicate
- Pin states
- Functions
- Variables
- Values
- Strings
- Numbers
- Operators
- Control
-
About BlocklyProp Updates
- 4×4 Keypad Wiring & Example Code
- About Naming Things
- Air Quality BME680
- Badge Display
- 4 x 4 Keypad
- ColorPal Wiring & Code Example
- Sound Impact Wiring & Example Code
- GPS Wiring & Example Code
- PIR Wiring & Example Code
- About BlocklyProp Updates
- Badge LEDs
- Badge Lock
- Joystick Wiring & Example Code
- Fingerprint Scanner Wiring & Example Code
- About Multicore
- Temperature & Humidity Sensor Wiring & Example Code
- Memsic 2125 Wiring & Example Code
- GPS
- System
- Badge Buttons
- PING))) Wiring & Example Code
- RFID Wiring & Example Code
- Graph
- Temp & Humidity
- BlocklyProp Bulk Project Download
- About Board Types
- LIS3DH Accelerometer
- ePaper
- IR Remote Wiring & Example Code
- Fingerprint Scanner
- Arrays
- Advanced WX
- Simple WX
- WX WiFi
- RGB LEDs
- LSM9DS1 9-axis IMU
- Robot
- PWM
- Pulse in / out
- Voltage
- RC time
- Servo
- Audio
- Analog / Pulses
- Memory
- ColorPal
- Sound Impact Sensor
- Sony Remote
- RFID
- PIR
- Ping))) Distance
- MMA7455
- Memsic 2-axis
- 2-Axis Joystick
- HMC5883L
- Sensor
- XBee
- Protocols
- Terminal
- OLED
- Serial LCD
- Communicate
- Pin states
- Functions
- Variables
- Values
- Strings
- Numbers
- Operators
- Control
-
Badge LEDs
- 4×4 Keypad Wiring & Example Code
- About Naming Things
- Air Quality BME680
- Badge Display
- 4 x 4 Keypad
- ColorPal Wiring & Code Example
- Sound Impact Wiring & Example Code
- GPS Wiring & Example Code
- PIR Wiring & Example Code
- About BlocklyProp Updates
- Badge LEDs
- Badge Lock
- Joystick Wiring & Example Code
- Fingerprint Scanner Wiring & Example Code
- About Multicore
- Temperature & Humidity Sensor Wiring & Example Code
- Memsic 2125 Wiring & Example Code
- GPS
- System
- Badge Buttons
- PING))) Wiring & Example Code
- RFID Wiring & Example Code
- Graph
- Temp & Humidity
- BlocklyProp Bulk Project Download
- About Board Types
- LIS3DH Accelerometer
- ePaper
- IR Remote Wiring & Example Code
- Fingerprint Scanner
- Arrays
- Advanced WX
- Simple WX
- WX WiFi
- RGB LEDs
- LSM9DS1 9-axis IMU
- Robot
- PWM
- Pulse in / out
- Voltage
- RC time
- Servo
- Audio
- Analog / Pulses
- Memory
- ColorPal
- Sound Impact Sensor
- Sony Remote
- RFID
- PIR
- Ping))) Distance
- MMA7455
- Memsic 2-axis
- 2-Axis Joystick
- HMC5883L
- Sensor
- XBee
- Protocols
- Terminal
- OLED
- Serial LCD
- Communicate
- Pin states
- Functions
- Variables
- Values
- Strings
- Numbers
- Operators
- Control
-
Badge Lock
- 4×4 Keypad Wiring & Example Code
- About Naming Things
- Air Quality BME680
- Badge Display
- 4 x 4 Keypad
- ColorPal Wiring & Code Example
- Sound Impact Wiring & Example Code
- GPS Wiring & Example Code
- PIR Wiring & Example Code
- About BlocklyProp Updates
- Badge LEDs
- Badge Lock
- Joystick Wiring & Example Code
- Fingerprint Scanner Wiring & Example Code
- About Multicore
- Temperature & Humidity Sensor Wiring & Example Code
- Memsic 2125 Wiring & Example Code
- GPS
- System
- Badge Buttons
- PING))) Wiring & Example Code
- RFID Wiring & Example Code
- Graph
- Temp & Humidity
- BlocklyProp Bulk Project Download
- About Board Types
- LIS3DH Accelerometer
- ePaper
- IR Remote Wiring & Example Code
- Fingerprint Scanner
- Arrays
- Advanced WX
- Simple WX
- WX WiFi
- RGB LEDs
- LSM9DS1 9-axis IMU
- Robot
- PWM
- Pulse in / out
- Voltage
- RC time
- Servo
- Audio
- Analog / Pulses
- Memory
- ColorPal
- Sound Impact Sensor
- Sony Remote
- RFID
- PIR
- Ping))) Distance
- MMA7455
- Memsic 2-axis
- 2-Axis Joystick
- HMC5883L
- Sensor
- XBee
- Protocols
- Terminal
- OLED
- Serial LCD
- Communicate
- Pin states
- Functions
- Variables
- Values
- Strings
- Numbers
- Operators
- Control
-
Joystick Wiring & Example Code
- 4×4 Keypad Wiring & Example Code
- About Naming Things
- Air Quality BME680
- Badge Display
- 4 x 4 Keypad
- ColorPal Wiring & Code Example
- Sound Impact Wiring & Example Code
- GPS Wiring & Example Code
- PIR Wiring & Example Code
- About BlocklyProp Updates
- Badge LEDs
- Badge Lock
- Joystick Wiring & Example Code
- Fingerprint Scanner Wiring & Example Code
- About Multicore
- Temperature & Humidity Sensor Wiring & Example Code
- Memsic 2125 Wiring & Example Code
- GPS
- System
- Badge Buttons
- PING))) Wiring & Example Code
- RFID Wiring & Example Code
- Graph
- Temp & Humidity
- BlocklyProp Bulk Project Download
- About Board Types
- LIS3DH Accelerometer
- ePaper
- IR Remote Wiring & Example Code
- Fingerprint Scanner
- Arrays
- Advanced WX
- Simple WX
- WX WiFi
- RGB LEDs
- LSM9DS1 9-axis IMU
- Robot
- PWM
- Pulse in / out
- Voltage
- RC time
- Servo
- Audio
- Analog / Pulses
- Memory
- ColorPal
- Sound Impact Sensor
- Sony Remote
- RFID
- PIR
- Ping))) Distance
- MMA7455
- Memsic 2-axis
- 2-Axis Joystick
- HMC5883L
- Sensor
- XBee
- Protocols
- Terminal
- OLED
- Serial LCD
- Communicate
- Pin states
- Functions
- Variables
- Values
- Strings
- Numbers
- Operators
- Control
-
Fingerprint Scanner Wiring & Example Code
- 4×4 Keypad Wiring & Example Code
- About Naming Things
- Air Quality BME680
- Badge Display
- 4 x 4 Keypad
- ColorPal Wiring & Code Example
- Sound Impact Wiring & Example Code
- GPS Wiring & Example Code
- PIR Wiring & Example Code
- About BlocklyProp Updates
- Badge LEDs
- Badge Lock
- Joystick Wiring & Example Code
- Fingerprint Scanner Wiring & Example Code
- About Multicore
- Temperature & Humidity Sensor Wiring & Example Code
- Memsic 2125 Wiring & Example Code
- GPS
- System
- Badge Buttons
- PING))) Wiring & Example Code
- RFID Wiring & Example Code
- Graph
- Temp & Humidity
- BlocklyProp Bulk Project Download
- About Board Types
- LIS3DH Accelerometer
- ePaper
- IR Remote Wiring & Example Code
- Fingerprint Scanner
- Arrays
- Advanced WX
- Simple WX
- WX WiFi
- RGB LEDs
- LSM9DS1 9-axis IMU
- Robot
- PWM
- Pulse in / out
- Voltage
- RC time
- Servo
- Audio
- Analog / Pulses
- Memory
- ColorPal
- Sound Impact Sensor
- Sony Remote
- RFID
- PIR
- Ping))) Distance
- MMA7455
- Memsic 2-axis
- 2-Axis Joystick
- HMC5883L
- Sensor
- XBee
- Protocols
- Terminal
- OLED
- Serial LCD
- Communicate
- Pin states
- Functions
- Variables
- Values
- Strings
- Numbers
- Operators
- Control
-
About Multicore
- 4×4 Keypad Wiring & Example Code
- About Naming Things
- Air Quality BME680
- Badge Display
- 4 x 4 Keypad
- ColorPal Wiring & Code Example
- Sound Impact Wiring & Example Code
- GPS Wiring & Example Code
- PIR Wiring & Example Code
- About BlocklyProp Updates
- Badge LEDs
- Badge Lock
- Joystick Wiring & Example Code
- Fingerprint Scanner Wiring & Example Code
- About Multicore
- Temperature & Humidity Sensor Wiring & Example Code
- Memsic 2125 Wiring & Example Code
- GPS
- System
- Badge Buttons
- PING))) Wiring & Example Code
- RFID Wiring & Example Code
- Graph
- Temp & Humidity
- BlocklyProp Bulk Project Download
- About Board Types
- LIS3DH Accelerometer
- ePaper
- IR Remote Wiring & Example Code
- Fingerprint Scanner
- Arrays
- Advanced WX
- Simple WX
- WX WiFi
- RGB LEDs
- LSM9DS1 9-axis IMU
- Robot
- PWM
- Pulse in / out
- Voltage
- RC time
- Servo
- Audio
- Analog / Pulses
- Memory
- ColorPal
- Sound Impact Sensor
- Sony Remote
- RFID
- PIR
- Ping))) Distance
- MMA7455
- Memsic 2-axis
- 2-Axis Joystick
- HMC5883L
- Sensor
- XBee
- Protocols
- Terminal
- OLED
- Serial LCD
- Communicate
- Pin states
- Functions
- Variables
- Values
- Strings
- Numbers
- Operators
- Control
-
Temperature & Humidity Sensor Wiring & Example Code
- 4×4 Keypad Wiring & Example Code
- About Naming Things
- Air Quality BME680
- Badge Display
- 4 x 4 Keypad
- ColorPal Wiring & Code Example
- Sound Impact Wiring & Example Code
- GPS Wiring & Example Code
- PIR Wiring & Example Code
- About BlocklyProp Updates
- Badge LEDs
- Badge Lock
- Joystick Wiring & Example Code
- Fingerprint Scanner Wiring & Example Code
- About Multicore
- Temperature & Humidity Sensor Wiring & Example Code
- Memsic 2125 Wiring & Example Code
- GPS
- System
- Badge Buttons
- PING))) Wiring & Example Code
- RFID Wiring & Example Code
- Graph
- Temp & Humidity
- BlocklyProp Bulk Project Download
- About Board Types
- LIS3DH Accelerometer
- ePaper
- IR Remote Wiring & Example Code
- Fingerprint Scanner
- Arrays
- Advanced WX
- Simple WX
- WX WiFi
- RGB LEDs
- LSM9DS1 9-axis IMU
- Robot
- PWM
- Pulse in / out
- Voltage
- RC time
- Servo
- Audio
- Analog / Pulses
- Memory
- ColorPal
- Sound Impact Sensor
- Sony Remote
- RFID
- PIR
- Ping))) Distance
- MMA7455
- Memsic 2-axis
- 2-Axis Joystick
- HMC5883L
- Sensor
- XBee
- Protocols
- Terminal
- OLED
- Serial LCD
- Communicate
- Pin states
- Functions
- Variables
- Values
- Strings
- Numbers
- Operators
- Control
-
Memsic 2125 Wiring & Example Code
- 4×4 Keypad Wiring & Example Code
- About Naming Things
- Air Quality BME680
- Badge Display
- 4 x 4 Keypad
- ColorPal Wiring & Code Example
- Sound Impact Wiring & Example Code
- GPS Wiring & Example Code
- PIR Wiring & Example Code
- About BlocklyProp Updates
- Badge LEDs
- Badge Lock
- Joystick Wiring & Example Code
- Fingerprint Scanner Wiring & Example Code
- About Multicore
- Temperature & Humidity Sensor Wiring & Example Code
- Memsic 2125 Wiring & Example Code
- GPS
- System
- Badge Buttons
- PING))) Wiring & Example Code
- RFID Wiring & Example Code
- Graph
- Temp & Humidity
- BlocklyProp Bulk Project Download
- About Board Types
- LIS3DH Accelerometer
- ePaper
- IR Remote Wiring & Example Code
- Fingerprint Scanner
- Arrays
- Advanced WX
- Simple WX
- WX WiFi
- RGB LEDs
- LSM9DS1 9-axis IMU
- Robot
- PWM
- Pulse in / out
- Voltage
- RC time
- Servo
- Audio
- Analog / Pulses
- Memory
- ColorPal
- Sound Impact Sensor
- Sony Remote
- RFID
- PIR
- Ping))) Distance
- MMA7455
- Memsic 2-axis
- 2-Axis Joystick
- HMC5883L
- Sensor
- XBee
- Protocols
- Terminal
- OLED
- Serial LCD
- Communicate
- Pin states
- Functions
- Variables
- Values
- Strings
- Numbers
- Operators
- Control
-
GPS
- 4×4 Keypad Wiring & Example Code
- About Naming Things
- Air Quality BME680
- Badge Display
- 4 x 4 Keypad
- ColorPal Wiring & Code Example
- Sound Impact Wiring & Example Code
- GPS Wiring & Example Code
- PIR Wiring & Example Code
- About BlocklyProp Updates
- Badge LEDs
- Badge Lock
- Joystick Wiring & Example Code
- Fingerprint Scanner Wiring & Example Code
- About Multicore
- Temperature & Humidity Sensor Wiring & Example Code
- Memsic 2125 Wiring & Example Code
- GPS
- System
- Badge Buttons
- PING))) Wiring & Example Code
- RFID Wiring & Example Code
- Graph
- Temp & Humidity
- BlocklyProp Bulk Project Download
- About Board Types
- LIS3DH Accelerometer
- ePaper
- IR Remote Wiring & Example Code
- Fingerprint Scanner
- Arrays
- Advanced WX
- Simple WX
- WX WiFi
- RGB LEDs
- LSM9DS1 9-axis IMU
- Robot
- PWM
- Pulse in / out
- Voltage
- RC time
- Servo
- Audio
- Analog / Pulses
- Memory
- ColorPal
- Sound Impact Sensor
- Sony Remote
- RFID
- PIR
- Ping))) Distance
- MMA7455
- Memsic 2-axis
- 2-Axis Joystick
- HMC5883L
- Sensor
- XBee
- Protocols
- Terminal
- OLED
- Serial LCD
- Communicate
- Pin states
- Functions
- Variables
- Values
- Strings
- Numbers
- Operators
- Control
-
System
- 4×4 Keypad Wiring & Example Code
- About Naming Things
- Air Quality BME680
- Badge Display
- 4 x 4 Keypad
- ColorPal Wiring & Code Example
- Sound Impact Wiring & Example Code
- GPS Wiring & Example Code
- PIR Wiring & Example Code
- About BlocklyProp Updates
- Badge LEDs
- Badge Lock
- Joystick Wiring & Example Code
- Fingerprint Scanner Wiring & Example Code
- About Multicore
- Temperature & Humidity Sensor Wiring & Example Code
- Memsic 2125 Wiring & Example Code
- GPS
- System
- Badge Buttons
- PING))) Wiring & Example Code
- RFID Wiring & Example Code
- Graph
- Temp & Humidity
- BlocklyProp Bulk Project Download
- About Board Types
- LIS3DH Accelerometer
- ePaper
- IR Remote Wiring & Example Code
- Fingerprint Scanner
- Arrays
- Advanced WX
- Simple WX
- WX WiFi
- RGB LEDs
- LSM9DS1 9-axis IMU
- Robot
- PWM
- Pulse in / out
- Voltage
- RC time
- Servo
- Audio
- Analog / Pulses
- Memory
- ColorPal
- Sound Impact Sensor
- Sony Remote
- RFID
- PIR
- Ping))) Distance
- MMA7455
- Memsic 2-axis
- 2-Axis Joystick
- HMC5883L
- Sensor
- XBee
- Protocols
- Terminal
- OLED
- Serial LCD
- Communicate
- Pin states
- Functions
- Variables
- Values
- Strings
- Numbers
- Operators
- Control
-
Badge Buttons
- 4×4 Keypad Wiring & Example Code
- About Naming Things
- Air Quality BME680
- Badge Display
- 4 x 4 Keypad
- ColorPal Wiring & Code Example
- Sound Impact Wiring & Example Code
- GPS Wiring & Example Code
- PIR Wiring & Example Code
- About BlocklyProp Updates
- Badge LEDs
- Badge Lock
- Joystick Wiring & Example Code
- Fingerprint Scanner Wiring & Example Code
- About Multicore
- Temperature & Humidity Sensor Wiring & Example Code
- Memsic 2125 Wiring & Example Code
- GPS
- System
- Badge Buttons
- PING))) Wiring & Example Code
- RFID Wiring & Example Code
- Graph
- Temp & Humidity
- BlocklyProp Bulk Project Download
- About Board Types
- LIS3DH Accelerometer
- ePaper
- IR Remote Wiring & Example Code
- Fingerprint Scanner
- Arrays
- Advanced WX
- Simple WX
- WX WiFi
- RGB LEDs
- LSM9DS1 9-axis IMU
- Robot
- PWM
- Pulse in / out
- Voltage
- RC time
- Servo
- Audio
- Analog / Pulses
- Memory
- ColorPal
- Sound Impact Sensor
- Sony Remote
- RFID
- PIR
- Ping))) Distance
- MMA7455
- Memsic 2-axis
- 2-Axis Joystick
- HMC5883L
- Sensor
- XBee
- Protocols
- Terminal
- OLED
- Serial LCD
- Communicate
- Pin states
- Functions
- Variables
- Values
- Strings
- Numbers
- Operators
- Control
-
PING))) Wiring & Example Code
- 4×4 Keypad Wiring & Example Code
- About Naming Things
- Air Quality BME680
- Badge Display
- 4 x 4 Keypad
- ColorPal Wiring & Code Example
- Sound Impact Wiring & Example Code
- GPS Wiring & Example Code
- PIR Wiring & Example Code
- About BlocklyProp Updates
- Badge LEDs
- Badge Lock
- Joystick Wiring & Example Code
- Fingerprint Scanner Wiring & Example Code
- About Multicore
- Temperature & Humidity Sensor Wiring & Example Code
- Memsic 2125 Wiring & Example Code
- GPS
- System
- Badge Buttons
- PING))) Wiring & Example Code
- RFID Wiring & Example Code
- Graph
- Temp & Humidity
- BlocklyProp Bulk Project Download
- About Board Types
- LIS3DH Accelerometer
- ePaper
- IR Remote Wiring & Example Code
- Fingerprint Scanner
- Arrays
- Advanced WX
- Simple WX
- WX WiFi
- RGB LEDs
- LSM9DS1 9-axis IMU
- Robot
- PWM
- Pulse in / out
- Voltage
- RC time
- Servo
- Audio
- Analog / Pulses
- Memory
- ColorPal
- Sound Impact Sensor
- Sony Remote
- RFID
- PIR
- Ping))) Distance
- MMA7455
- Memsic 2-axis
- 2-Axis Joystick
- HMC5883L
- Sensor
- XBee
- Protocols
- Terminal
- OLED
- Serial LCD
- Communicate
- Pin states
- Functions
- Variables
- Values
- Strings
- Numbers
- Operators
- Control
-
RFID Wiring & Example Code
- 4×4 Keypad Wiring & Example Code
- About Naming Things
- Air Quality BME680
- Badge Display
- 4 x 4 Keypad
- ColorPal Wiring & Code Example
- Sound Impact Wiring & Example Code
- GPS Wiring & Example Code
- PIR Wiring & Example Code
- About BlocklyProp Updates
- Badge LEDs
- Badge Lock
- Joystick Wiring & Example Code
- Fingerprint Scanner Wiring & Example Code
- About Multicore
- Temperature & Humidity Sensor Wiring & Example Code
- Memsic 2125 Wiring & Example Code
- GPS
- System
- Badge Buttons
- PING))) Wiring & Example Code
- RFID Wiring & Example Code
- Graph
- Temp & Humidity
- BlocklyProp Bulk Project Download
- About Board Types
- LIS3DH Accelerometer
- ePaper
- IR Remote Wiring & Example Code
- Fingerprint Scanner
- Arrays
- Advanced WX
- Simple WX
- WX WiFi
- RGB LEDs
- LSM9DS1 9-axis IMU
- Robot
- PWM
- Pulse in / out
- Voltage
- RC time
- Servo
- Audio
- Analog / Pulses
- Memory
- ColorPal
- Sound Impact Sensor
- Sony Remote
- RFID
- PIR
- Ping))) Distance
- MMA7455
- Memsic 2-axis
- 2-Axis Joystick
- HMC5883L
- Sensor
- XBee
- Protocols
- Terminal
- OLED
- Serial LCD
- Communicate
- Pin states
- Functions
- Variables
- Values
- Strings
- Numbers
- Operators
- Control
-
Graph
- 4×4 Keypad Wiring & Example Code
- About Naming Things
- Air Quality BME680
- Badge Display
- 4 x 4 Keypad
- ColorPal Wiring & Code Example
- Sound Impact Wiring & Example Code
- GPS Wiring & Example Code
- PIR Wiring & Example Code
- About BlocklyProp Updates
- Badge LEDs
- Badge Lock
- Joystick Wiring & Example Code
- Fingerprint Scanner Wiring & Example Code
- About Multicore
- Temperature & Humidity Sensor Wiring & Example Code
- Memsic 2125 Wiring & Example Code
- GPS
- System
- Badge Buttons
- PING))) Wiring & Example Code
- RFID Wiring & Example Code
- Graph
- Temp & Humidity
- BlocklyProp Bulk Project Download
- About Board Types
- LIS3DH Accelerometer
- ePaper
- IR Remote Wiring & Example Code
- Fingerprint Scanner
- Arrays
- Advanced WX
- Simple WX
- WX WiFi
- RGB LEDs
- LSM9DS1 9-axis IMU
- Robot
- PWM
- Pulse in / out
- Voltage
- RC time
- Servo
- Audio
- Analog / Pulses
- Memory
- ColorPal
- Sound Impact Sensor
- Sony Remote
- RFID
- PIR
- Ping))) Distance
- MMA7455
- Memsic 2-axis
- 2-Axis Joystick
- HMC5883L
- Sensor
- XBee
- Protocols
- Terminal
- OLED
- Serial LCD
- Communicate
- Pin states
- Functions
- Variables
- Values
- Strings
- Numbers
- Operators
- Control
-
Temp & Humidity
- 4×4 Keypad Wiring & Example Code
- About Naming Things
- Air Quality BME680
- Badge Display
- 4 x 4 Keypad
- ColorPal Wiring & Code Example
- Sound Impact Wiring & Example Code
- GPS Wiring & Example Code
- PIR Wiring & Example Code
- About BlocklyProp Updates
- Badge LEDs
- Badge Lock
- Joystick Wiring & Example Code
- Fingerprint Scanner Wiring & Example Code
- About Multicore
- Temperature & Humidity Sensor Wiring & Example Code
- Memsic 2125 Wiring & Example Code
- GPS
- System
- Badge Buttons
- PING))) Wiring & Example Code
- RFID Wiring & Example Code
- Graph
- Temp & Humidity
- BlocklyProp Bulk Project Download
- About Board Types
- LIS3DH Accelerometer
- ePaper
- IR Remote Wiring & Example Code
- Fingerprint Scanner
- Arrays
- Advanced WX
- Simple WX
- WX WiFi
- RGB LEDs
- LSM9DS1 9-axis IMU
- Robot
- PWM
- Pulse in / out
- Voltage
- RC time
- Servo
- Audio
- Analog / Pulses
- Memory
- ColorPal
- Sound Impact Sensor
- Sony Remote
- RFID
- PIR
- Ping))) Distance
- MMA7455
- Memsic 2-axis
- 2-Axis Joystick
- HMC5883L
- Sensor
- XBee
- Protocols
- Terminal
- OLED
- Serial LCD
- Communicate
- Pin states
- Functions
- Variables
- Values
- Strings
- Numbers
- Operators
- Control
-
BlocklyProp Bulk Project Download
- 4×4 Keypad Wiring & Example Code
- About Naming Things
- Air Quality BME680
- Badge Display
- 4 x 4 Keypad
- ColorPal Wiring & Code Example
- Sound Impact Wiring & Example Code
- GPS Wiring & Example Code
- PIR Wiring & Example Code
- About BlocklyProp Updates
- Badge LEDs
- Badge Lock
- Joystick Wiring & Example Code
- Fingerprint Scanner Wiring & Example Code
- About Multicore
- Temperature & Humidity Sensor Wiring & Example Code
- Memsic 2125 Wiring & Example Code
- GPS
- System
- Badge Buttons
- PING))) Wiring & Example Code
- RFID Wiring & Example Code
- Graph
- Temp & Humidity
- BlocklyProp Bulk Project Download
- About Board Types
- LIS3DH Accelerometer
- ePaper
- IR Remote Wiring & Example Code
- Fingerprint Scanner
- Arrays
- Advanced WX
- Simple WX
- WX WiFi
- RGB LEDs
- LSM9DS1 9-axis IMU
- Robot
- PWM
- Pulse in / out
- Voltage
- RC time
- Servo
- Audio
- Analog / Pulses
- Memory
- ColorPal
- Sound Impact Sensor
- Sony Remote
- RFID
- PIR
- Ping))) Distance
- MMA7455
- Memsic 2-axis
- 2-Axis Joystick
- HMC5883L
- Sensor
- XBee
- Protocols
- Terminal
- OLED
- Serial LCD
- Communicate
- Pin states
- Functions
- Variables
- Values
- Strings
- Numbers
- Operators
- Control
-
About Board Types
- 4×4 Keypad Wiring & Example Code
- About Naming Things
- Air Quality BME680
- Badge Display
- 4 x 4 Keypad
- ColorPal Wiring & Code Example
- Sound Impact Wiring & Example Code
- GPS Wiring & Example Code
- PIR Wiring & Example Code
- About BlocklyProp Updates
- Badge LEDs
- Badge Lock
- Joystick Wiring & Example Code
- Fingerprint Scanner Wiring & Example Code
- About Multicore
- Temperature & Humidity Sensor Wiring & Example Code
- Memsic 2125 Wiring & Example Code
- GPS
- System
- Badge Buttons
- PING))) Wiring & Example Code
- RFID Wiring & Example Code
- Graph
- Temp & Humidity
- BlocklyProp Bulk Project Download
- About Board Types
- LIS3DH Accelerometer
- ePaper
- IR Remote Wiring & Example Code
- Fingerprint Scanner
- Arrays
- Advanced WX
- Simple WX
- WX WiFi
- RGB LEDs
- LSM9DS1 9-axis IMU
- Robot
- PWM
- Pulse in / out
- Voltage
- RC time
- Servo
- Audio
- Analog / Pulses
- Memory
- ColorPal
- Sound Impact Sensor
- Sony Remote
- RFID
- PIR
- Ping))) Distance
- MMA7455
- Memsic 2-axis
- 2-Axis Joystick
- HMC5883L
- Sensor
- XBee
- Protocols
- Terminal
- OLED
- Serial LCD
- Communicate
- Pin states
- Functions
- Variables
- Values
- Strings
- Numbers
- Operators
- Control
-
LIS3DH Accelerometer
- 4×4 Keypad Wiring & Example Code
- About Naming Things
- Air Quality BME680
- Badge Display
- 4 x 4 Keypad
- ColorPal Wiring & Code Example
- Sound Impact Wiring & Example Code
- GPS Wiring & Example Code
- PIR Wiring & Example Code
- About BlocklyProp Updates
- Badge LEDs
- Badge Lock
- Joystick Wiring & Example Code
- Fingerprint Scanner Wiring & Example Code
- About Multicore
- Temperature & Humidity Sensor Wiring & Example Code
- Memsic 2125 Wiring & Example Code
- GPS
- System
- Badge Buttons
- PING))) Wiring & Example Code
- RFID Wiring & Example Code
- Graph
- Temp & Humidity
- BlocklyProp Bulk Project Download
- About Board Types
- LIS3DH Accelerometer
- ePaper
- IR Remote Wiring & Example Code
- Fingerprint Scanner
- Arrays
- Advanced WX
- Simple WX
- WX WiFi
- RGB LEDs
- LSM9DS1 9-axis IMU
- Robot
- PWM
- Pulse in / out
- Voltage
- RC time
- Servo
- Audio
- Analog / Pulses
- Memory
- ColorPal
- Sound Impact Sensor
- Sony Remote
- RFID
- PIR
- Ping))) Distance
- MMA7455
- Memsic 2-axis
- 2-Axis Joystick
- HMC5883L
- Sensor
- XBee
- Protocols
- Terminal
- OLED
- Serial LCD
- Communicate
- Pin states
- Functions
- Variables
- Values
- Strings
- Numbers
- Operators
- Control
-
ePaper
- 4×4 Keypad Wiring & Example Code
- About Naming Things
- Air Quality BME680
- Badge Display
- 4 x 4 Keypad
- ColorPal Wiring & Code Example
- Sound Impact Wiring & Example Code
- GPS Wiring & Example Code
- PIR Wiring & Example Code
- About BlocklyProp Updates
- Badge LEDs
- Badge Lock
- Joystick Wiring & Example Code
- Fingerprint Scanner Wiring & Example Code
- About Multicore
- Temperature & Humidity Sensor Wiring & Example Code
- Memsic 2125 Wiring & Example Code
- GPS
- System
- Badge Buttons
- PING))) Wiring & Example Code
- RFID Wiring & Example Code
- Graph
- Temp & Humidity
- BlocklyProp Bulk Project Download
- About Board Types
- LIS3DH Accelerometer
- ePaper
- IR Remote Wiring & Example Code
- Fingerprint Scanner
- Arrays
- Advanced WX
- Simple WX
- WX WiFi
- RGB LEDs
- LSM9DS1 9-axis IMU
- Robot
- PWM
- Pulse in / out
- Voltage
- RC time
- Servo
- Audio
- Analog / Pulses
- Memory
- ColorPal
- Sound Impact Sensor
- Sony Remote
- RFID
- PIR
- Ping))) Distance
- MMA7455
- Memsic 2-axis
- 2-Axis Joystick
- HMC5883L
- Sensor
- XBee
- Protocols
- Terminal
- OLED
- Serial LCD
- Communicate
- Pin states
- Functions
- Variables
- Values
- Strings
- Numbers
- Operators
- Control
-
IR Remote Wiring & Example Code
- 4×4 Keypad Wiring & Example Code
- About Naming Things
- Air Quality BME680
- Badge Display
- 4 x 4 Keypad
- ColorPal Wiring & Code Example
- Sound Impact Wiring & Example Code
- GPS Wiring & Example Code
- PIR Wiring & Example Code
- About BlocklyProp Updates
- Badge LEDs
- Badge Lock
- Joystick Wiring & Example Code
- Fingerprint Scanner Wiring & Example Code
- About Multicore
- Temperature & Humidity Sensor Wiring & Example Code
- Memsic 2125 Wiring & Example Code
- GPS
- System
- Badge Buttons
- PING))) Wiring & Example Code
- RFID Wiring & Example Code
- Graph
- Temp & Humidity
- BlocklyProp Bulk Project Download
- About Board Types
- LIS3DH Accelerometer
- ePaper
- IR Remote Wiring & Example Code
- Fingerprint Scanner
- Arrays
- Advanced WX
- Simple WX
- WX WiFi
- RGB LEDs
- LSM9DS1 9-axis IMU
- Robot
- PWM
- Pulse in / out
- Voltage
- RC time
- Servo
- Audio
- Analog / Pulses
- Memory
- ColorPal
- Sound Impact Sensor
- Sony Remote
- RFID
- PIR
- Ping))) Distance
- MMA7455
- Memsic 2-axis
- 2-Axis Joystick
- HMC5883L
- Sensor
- XBee
- Protocols
- Terminal
- OLED
- Serial LCD
- Communicate
- Pin states
- Functions
- Variables
- Values
- Strings
- Numbers
- Operators
- Control
-
Fingerprint Scanner
- 4×4 Keypad Wiring & Example Code
- About Naming Things
- Air Quality BME680
- Badge Display
- 4 x 4 Keypad
- ColorPal Wiring & Code Example
- Sound Impact Wiring & Example Code
- GPS Wiring & Example Code
- PIR Wiring & Example Code
- About BlocklyProp Updates
- Badge LEDs
- Badge Lock
- Joystick Wiring & Example Code
- Fingerprint Scanner Wiring & Example Code
- About Multicore
- Temperature & Humidity Sensor Wiring & Example Code
- Memsic 2125 Wiring & Example Code
- GPS
- System
- Badge Buttons
- PING))) Wiring & Example Code
- RFID Wiring & Example Code
- Graph
- Temp & Humidity
- BlocklyProp Bulk Project Download
- About Board Types
- LIS3DH Accelerometer
- ePaper
- IR Remote Wiring & Example Code
- Fingerprint Scanner
- Arrays
- Advanced WX
- Simple WX
- WX WiFi
- RGB LEDs
- LSM9DS1 9-axis IMU
- Robot
- PWM
- Pulse in / out
- Voltage
- RC time
- Servo
- Audio
- Analog / Pulses
- Memory
- ColorPal
- Sound Impact Sensor
- Sony Remote
- RFID
- PIR
- Ping))) Distance
- MMA7455
- Memsic 2-axis
- 2-Axis Joystick
- HMC5883L
- Sensor
- XBee
- Protocols
- Terminal
- OLED
- Serial LCD
- Communicate
- Pin states
- Functions
- Variables
- Values
- Strings
- Numbers
- Operators
- Control
-
Arrays
- 4×4 Keypad Wiring & Example Code
- About Naming Things
- Air Quality BME680
- Badge Display
- 4 x 4 Keypad
- ColorPal Wiring & Code Example
- Sound Impact Wiring & Example Code
- GPS Wiring & Example Code
- PIR Wiring & Example Code
- About BlocklyProp Updates
- Badge LEDs
- Badge Lock
- Joystick Wiring & Example Code
- Fingerprint Scanner Wiring & Example Code
- About Multicore
- Temperature & Humidity Sensor Wiring & Example Code
- Memsic 2125 Wiring & Example Code
- GPS
- System
- Badge Buttons
- PING))) Wiring & Example Code
- RFID Wiring & Example Code
- Graph
- Temp & Humidity
- BlocklyProp Bulk Project Download
- About Board Types
- LIS3DH Accelerometer
- ePaper
- IR Remote Wiring & Example Code
- Fingerprint Scanner
- Arrays
- Advanced WX
- Simple WX
- WX WiFi
- RGB LEDs
- LSM9DS1 9-axis IMU
- Robot
- PWM
- Pulse in / out
- Voltage
- RC time
- Servo
- Audio
- Analog / Pulses
- Memory
- ColorPal
- Sound Impact Sensor
- Sony Remote
- RFID
- PIR
- Ping))) Distance
- MMA7455
- Memsic 2-axis
- 2-Axis Joystick
- HMC5883L
- Sensor
- XBee
- Protocols
- Terminal
- OLED
- Serial LCD
- Communicate
- Pin states
- Functions
- Variables
- Values
- Strings
- Numbers
- Operators
- Control
-
Advanced WX
- 4×4 Keypad Wiring & Example Code
- About Naming Things
- Air Quality BME680
- Badge Display
- 4 x 4 Keypad
- ColorPal Wiring & Code Example
- Sound Impact Wiring & Example Code
- GPS Wiring & Example Code
- PIR Wiring & Example Code
- About BlocklyProp Updates
- Badge LEDs
- Badge Lock
- Joystick Wiring & Example Code
- Fingerprint Scanner Wiring & Example Code
- About Multicore
- Temperature & Humidity Sensor Wiring & Example Code
- Memsic 2125 Wiring & Example Code
- GPS
- System
- Badge Buttons
- PING))) Wiring & Example Code
- RFID Wiring & Example Code
- Graph
- Temp & Humidity
- BlocklyProp Bulk Project Download
- About Board Types
- LIS3DH Accelerometer
- ePaper
- IR Remote Wiring & Example Code
- Fingerprint Scanner
- Arrays
- Advanced WX
- Simple WX
- WX WiFi
- RGB LEDs
- LSM9DS1 9-axis IMU
- Robot
- PWM
- Pulse in / out
- Voltage
- RC time
- Servo
- Audio
- Analog / Pulses
- Memory
- ColorPal
- Sound Impact Sensor
- Sony Remote
- RFID
- PIR
- Ping))) Distance
- MMA7455
- Memsic 2-axis
- 2-Axis Joystick
- HMC5883L
- Sensor
- XBee
- Protocols
- Terminal
- OLED
- Serial LCD
- Communicate
- Pin states
- Functions
- Variables
- Values
- Strings
- Numbers
- Operators
- Control
-
Simple WX
- 4×4 Keypad Wiring & Example Code
- About Naming Things
- Air Quality BME680
- Badge Display
- 4 x 4 Keypad
- ColorPal Wiring & Code Example
- Sound Impact Wiring & Example Code
- GPS Wiring & Example Code
- PIR Wiring & Example Code
- About BlocklyProp Updates
- Badge LEDs
- Badge Lock
- Joystick Wiring & Example Code
- Fingerprint Scanner Wiring & Example Code
- About Multicore
- Temperature & Humidity Sensor Wiring & Example Code
- Memsic 2125 Wiring & Example Code
- GPS
- System
- Badge Buttons
- PING))) Wiring & Example Code
- RFID Wiring & Example Code
- Graph
- Temp & Humidity
- BlocklyProp Bulk Project Download
- About Board Types
- LIS3DH Accelerometer
- ePaper
- IR Remote Wiring & Example Code
- Fingerprint Scanner
- Arrays
- Advanced WX
- Simple WX
- WX WiFi
- RGB LEDs
- LSM9DS1 9-axis IMU
- Robot
- PWM
- Pulse in / out
- Voltage
- RC time
- Servo
- Audio
- Analog / Pulses
- Memory
- ColorPal
- Sound Impact Sensor
- Sony Remote
- RFID
- PIR
- Ping))) Distance
- MMA7455
- Memsic 2-axis
- 2-Axis Joystick
- HMC5883L
- Sensor
- XBee
- Protocols
- Terminal
- OLED
- Serial LCD
- Communicate
- Pin states
- Functions
- Variables
- Values
- Strings
- Numbers
- Operators
- Control
-
WX WiFi
- 4×4 Keypad Wiring & Example Code
- About Naming Things
- Air Quality BME680
- Badge Display
- 4 x 4 Keypad
- ColorPal Wiring & Code Example
- Sound Impact Wiring & Example Code
- GPS Wiring & Example Code
- PIR Wiring & Example Code
- About BlocklyProp Updates
- Badge LEDs
- Badge Lock
- Joystick Wiring & Example Code
- Fingerprint Scanner Wiring & Example Code
- About Multicore
- Temperature & Humidity Sensor Wiring & Example Code
- Memsic 2125 Wiring & Example Code
- GPS
- System
- Badge Buttons
- PING))) Wiring & Example Code
- RFID Wiring & Example Code
- Graph
- Temp & Humidity
- BlocklyProp Bulk Project Download
- About Board Types
- LIS3DH Accelerometer
- ePaper
- IR Remote Wiring & Example Code
- Fingerprint Scanner
- Arrays
- Advanced WX
- Simple WX
- WX WiFi
- RGB LEDs
- LSM9DS1 9-axis IMU
- Robot
- PWM
- Pulse in / out
- Voltage
- RC time
- Servo
- Audio
- Analog / Pulses
- Memory
- ColorPal
- Sound Impact Sensor
- Sony Remote
- RFID
- PIR
- Ping))) Distance
- MMA7455
- Memsic 2-axis
- 2-Axis Joystick
- HMC5883L
- Sensor
- XBee
- Protocols
- Terminal
- OLED
- Serial LCD
- Communicate
- Pin states
- Functions
- Variables
- Values
- Strings
- Numbers
- Operators
- Control
-
RGB LEDs
- 4×4 Keypad Wiring & Example Code
- About Naming Things
- Air Quality BME680
- Badge Display
- 4 x 4 Keypad
- ColorPal Wiring & Code Example
- Sound Impact Wiring & Example Code
- GPS Wiring & Example Code
- PIR Wiring & Example Code
- About BlocklyProp Updates
- Badge LEDs
- Badge Lock
- Joystick Wiring & Example Code
- Fingerprint Scanner Wiring & Example Code
- About Multicore
- Temperature & Humidity Sensor Wiring & Example Code
- Memsic 2125 Wiring & Example Code
- GPS
- System
- Badge Buttons
- PING))) Wiring & Example Code
- RFID Wiring & Example Code
- Graph
- Temp & Humidity
- BlocklyProp Bulk Project Download
- About Board Types
- LIS3DH Accelerometer
- ePaper
- IR Remote Wiring & Example Code
- Fingerprint Scanner
- Arrays
- Advanced WX
- Simple WX
- WX WiFi
- RGB LEDs
- LSM9DS1 9-axis IMU
- Robot
- PWM
- Pulse in / out
- Voltage
- RC time
- Servo
- Audio
- Analog / Pulses
- Memory
- ColorPal
- Sound Impact Sensor
- Sony Remote
- RFID
- PIR
- Ping))) Distance
- MMA7455
- Memsic 2-axis
- 2-Axis Joystick
- HMC5883L
- Sensor
- XBee
- Protocols
- Terminal
- OLED
- Serial LCD
- Communicate
- Pin states
- Functions
- Variables
- Values
- Strings
- Numbers
- Operators
- Control
-
LSM9DS1 9-axis IMU
- 4×4 Keypad Wiring & Example Code
- About Naming Things
- Air Quality BME680
- Badge Display
- 4 x 4 Keypad
- ColorPal Wiring & Code Example
- Sound Impact Wiring & Example Code
- GPS Wiring & Example Code
- PIR Wiring & Example Code
- About BlocklyProp Updates
- Badge LEDs
- Badge Lock
- Joystick Wiring & Example Code
- Fingerprint Scanner Wiring & Example Code
- About Multicore
- Temperature & Humidity Sensor Wiring & Example Code
- Memsic 2125 Wiring & Example Code
- GPS
- System
- Badge Buttons
- PING))) Wiring & Example Code
- RFID Wiring & Example Code
- Graph
- Temp & Humidity
- BlocklyProp Bulk Project Download
- About Board Types
- LIS3DH Accelerometer
- ePaper
- IR Remote Wiring & Example Code
- Fingerprint Scanner
- Arrays
- Advanced WX
- Simple WX
- WX WiFi
- RGB LEDs
- LSM9DS1 9-axis IMU
- Robot
- PWM
- Pulse in / out
- Voltage
- RC time
- Servo
- Audio
- Analog / Pulses
- Memory
- ColorPal
- Sound Impact Sensor
- Sony Remote
- RFID
- PIR
- Ping))) Distance
- MMA7455
- Memsic 2-axis
- 2-Axis Joystick
- HMC5883L
- Sensor
- XBee
- Protocols
- Terminal
- OLED
- Serial LCD
- Communicate
- Pin states
- Functions
- Variables
- Values
- Strings
- Numbers
- Operators
- Control
-
Robot
- 4×4 Keypad Wiring & Example Code
- About Naming Things
- Air Quality BME680
- Badge Display
- 4 x 4 Keypad
- ColorPal Wiring & Code Example
- Sound Impact Wiring & Example Code
- GPS Wiring & Example Code
- PIR Wiring & Example Code
- About BlocklyProp Updates
- Badge LEDs
- Badge Lock
- Joystick Wiring & Example Code
- Fingerprint Scanner Wiring & Example Code
- About Multicore
- Temperature & Humidity Sensor Wiring & Example Code
- Memsic 2125 Wiring & Example Code
- GPS
- System
- Badge Buttons
- PING))) Wiring & Example Code
- RFID Wiring & Example Code
- Graph
- Temp & Humidity
- BlocklyProp Bulk Project Download
- About Board Types
- LIS3DH Accelerometer
- ePaper
- IR Remote Wiring & Example Code
- Fingerprint Scanner
- Arrays
- Advanced WX
- Simple WX
- WX WiFi
- RGB LEDs
- LSM9DS1 9-axis IMU
- Robot
- PWM
- Pulse in / out
- Voltage
- RC time
- Servo
- Audio
- Analog / Pulses
- Memory
- ColorPal
- Sound Impact Sensor
- Sony Remote
- RFID
- PIR
- Ping))) Distance
- MMA7455
- Memsic 2-axis
- 2-Axis Joystick
- HMC5883L
- Sensor
- XBee
- Protocols
- Terminal
- OLED
- Serial LCD
- Communicate
- Pin states
- Functions
- Variables
- Values
- Strings
- Numbers
- Operators
- Control
-
PWM
- 4×4 Keypad Wiring & Example Code
- About Naming Things
- Air Quality BME680
- Badge Display
- 4 x 4 Keypad
- ColorPal Wiring & Code Example
- Sound Impact Wiring & Example Code
- GPS Wiring & Example Code
- PIR Wiring & Example Code
- About BlocklyProp Updates
- Badge LEDs
- Badge Lock
- Joystick Wiring & Example Code
- Fingerprint Scanner Wiring & Example Code
- About Multicore
- Temperature & Humidity Sensor Wiring & Example Code
- Memsic 2125 Wiring & Example Code
- GPS
- System
- Badge Buttons
- PING))) Wiring & Example Code
- RFID Wiring & Example Code
- Graph
- Temp & Humidity
- BlocklyProp Bulk Project Download
- About Board Types
- LIS3DH Accelerometer
- ePaper
- IR Remote Wiring & Example Code
- Fingerprint Scanner
- Arrays
- Advanced WX
- Simple WX
- WX WiFi
- RGB LEDs
- LSM9DS1 9-axis IMU
- Robot
- PWM
- Pulse in / out
- Voltage
- RC time
- Servo
- Audio
- Analog / Pulses
- Memory
- ColorPal
- Sound Impact Sensor
- Sony Remote
- RFID
- PIR
- Ping))) Distance
- MMA7455
- Memsic 2-axis
- 2-Axis Joystick
- HMC5883L
- Sensor
- XBee
- Protocols
- Terminal
- OLED
- Serial LCD
- Communicate
- Pin states
- Functions
- Variables
- Values
- Strings
- Numbers
- Operators
- Control
-
Pulse in / out
- 4×4 Keypad Wiring & Example Code
- About Naming Things
- Air Quality BME680
- Badge Display
- 4 x 4 Keypad
- ColorPal Wiring & Code Example
- Sound Impact Wiring & Example Code
- GPS Wiring & Example Code
- PIR Wiring & Example Code
- About BlocklyProp Updates
- Badge LEDs
- Badge Lock
- Joystick Wiring & Example Code
- Fingerprint Scanner Wiring & Example Code
- About Multicore
- Temperature & Humidity Sensor Wiring & Example Code
- Memsic 2125 Wiring & Example Code
- GPS
- System
- Badge Buttons
- PING))) Wiring & Example Code
- RFID Wiring & Example Code
- Graph
- Temp & Humidity
- BlocklyProp Bulk Project Download
- About Board Types
- LIS3DH Accelerometer
- ePaper
- IR Remote Wiring & Example Code
- Fingerprint Scanner
- Arrays
- Advanced WX
- Simple WX
- WX WiFi
- RGB LEDs
- LSM9DS1 9-axis IMU
- Robot
- PWM
- Pulse in / out
- Voltage
- RC time
- Servo
- Audio
- Analog / Pulses
- Memory
- ColorPal
- Sound Impact Sensor
- Sony Remote
- RFID
- PIR
- Ping))) Distance
- MMA7455
- Memsic 2-axis
- 2-Axis Joystick
- HMC5883L
- Sensor
- XBee
- Protocols
- Terminal
- OLED
- Serial LCD
- Communicate
- Pin states
- Functions
- Variables
- Values
- Strings
- Numbers
- Operators
- Control
-
Voltage
- 4×4 Keypad Wiring & Example Code
- About Naming Things
- Air Quality BME680
- Badge Display
- 4 x 4 Keypad
- ColorPal Wiring & Code Example
- Sound Impact Wiring & Example Code
- GPS Wiring & Example Code
- PIR Wiring & Example Code
- About BlocklyProp Updates
- Badge LEDs
- Badge Lock
- Joystick Wiring & Example Code
- Fingerprint Scanner Wiring & Example Code
- About Multicore
- Temperature & Humidity Sensor Wiring & Example Code
- Memsic 2125 Wiring & Example Code
- GPS
- System
- Badge Buttons
- PING))) Wiring & Example Code
- RFID Wiring & Example Code
- Graph
- Temp & Humidity
- BlocklyProp Bulk Project Download
- About Board Types
- LIS3DH Accelerometer
- ePaper
- IR Remote Wiring & Example Code
- Fingerprint Scanner
- Arrays
- Advanced WX
- Simple WX
- WX WiFi
- RGB LEDs
- LSM9DS1 9-axis IMU
- Robot
- PWM
- Pulse in / out
- Voltage
- RC time
- Servo
- Audio
- Analog / Pulses
- Memory
- ColorPal
- Sound Impact Sensor
- Sony Remote
- RFID
- PIR
- Ping))) Distance
- MMA7455
- Memsic 2-axis
- 2-Axis Joystick
- HMC5883L
- Sensor
- XBee
- Protocols
- Terminal
- OLED
- Serial LCD
- Communicate
- Pin states
- Functions
- Variables
- Values
- Strings
- Numbers
- Operators
- Control
-
RC time
- 4×4 Keypad Wiring & Example Code
- About Naming Things
- Air Quality BME680
- Badge Display
- 4 x 4 Keypad
- ColorPal Wiring & Code Example
- Sound Impact Wiring & Example Code
- GPS Wiring & Example Code
- PIR Wiring & Example Code
- About BlocklyProp Updates
- Badge LEDs
- Badge Lock
- Joystick Wiring & Example Code
- Fingerprint Scanner Wiring & Example Code
- About Multicore
- Temperature & Humidity Sensor Wiring & Example Code
- Memsic 2125 Wiring & Example Code
- GPS
- System
- Badge Buttons
- PING))) Wiring & Example Code
- RFID Wiring & Example Code
- Graph
- Temp & Humidity
- BlocklyProp Bulk Project Download
- About Board Types
- LIS3DH Accelerometer
- ePaper
- IR Remote Wiring & Example Code
- Fingerprint Scanner
- Arrays
- Advanced WX
- Simple WX
- WX WiFi
- RGB LEDs
- LSM9DS1 9-axis IMU
- Robot
- PWM
- Pulse in / out
- Voltage
- RC time
- Servo
- Audio
- Analog / Pulses
- Memory
- ColorPal
- Sound Impact Sensor
- Sony Remote
- RFID
- PIR
- Ping))) Distance
- MMA7455
- Memsic 2-axis
- 2-Axis Joystick
- HMC5883L
- Sensor
- XBee
- Protocols
- Terminal
- OLED
- Serial LCD
- Communicate
- Pin states
- Functions
- Variables
- Values
- Strings
- Numbers
- Operators
- Control
-
Servo
- 4×4 Keypad Wiring & Example Code
- About Naming Things
- Air Quality BME680
- Badge Display
- 4 x 4 Keypad
- ColorPal Wiring & Code Example
- Sound Impact Wiring & Example Code
- GPS Wiring & Example Code
- PIR Wiring & Example Code
- About BlocklyProp Updates
- Badge LEDs
- Badge Lock
- Joystick Wiring & Example Code
- Fingerprint Scanner Wiring & Example Code
- About Multicore
- Temperature & Humidity Sensor Wiring & Example Code
- Memsic 2125 Wiring & Example Code
- GPS
- System
- Badge Buttons
- PING))) Wiring & Example Code
- RFID Wiring & Example Code
- Graph
- Temp & Humidity
- BlocklyProp Bulk Project Download
- About Board Types
- LIS3DH Accelerometer
- ePaper
- IR Remote Wiring & Example Code
- Fingerprint Scanner
- Arrays
- Advanced WX
- Simple WX
- WX WiFi
- RGB LEDs
- LSM9DS1 9-axis IMU
- Robot
- PWM
- Pulse in / out
- Voltage
- RC time
- Servo
- Audio
- Analog / Pulses
- Memory
- ColorPal
- Sound Impact Sensor
- Sony Remote
- RFID
- PIR
- Ping))) Distance
- MMA7455
- Memsic 2-axis
- 2-Axis Joystick
- HMC5883L
- Sensor
- XBee
- Protocols
- Terminal
- OLED
- Serial LCD
- Communicate
- Pin states
- Functions
- Variables
- Values
- Strings
- Numbers
- Operators
- Control
-
Audio
- 4×4 Keypad Wiring & Example Code
- About Naming Things
- Air Quality BME680
- Badge Display
- 4 x 4 Keypad
- ColorPal Wiring & Code Example
- Sound Impact Wiring & Example Code
- GPS Wiring & Example Code
- PIR Wiring & Example Code
- About BlocklyProp Updates
- Badge LEDs
- Badge Lock
- Joystick Wiring & Example Code
- Fingerprint Scanner Wiring & Example Code
- About Multicore
- Temperature & Humidity Sensor Wiring & Example Code
- Memsic 2125 Wiring & Example Code
- GPS
- System
- Badge Buttons
- PING))) Wiring & Example Code
- RFID Wiring & Example Code
- Graph
- Temp & Humidity
- BlocklyProp Bulk Project Download
- About Board Types
- LIS3DH Accelerometer
- ePaper
- IR Remote Wiring & Example Code
- Fingerprint Scanner
- Arrays
- Advanced WX
- Simple WX
- WX WiFi
- RGB LEDs
- LSM9DS1 9-axis IMU
- Robot
- PWM
- Pulse in / out
- Voltage
- RC time
- Servo
- Audio
- Analog / Pulses
- Memory
- ColorPal
- Sound Impact Sensor
- Sony Remote
- RFID
- PIR
- Ping))) Distance
- MMA7455
- Memsic 2-axis
- 2-Axis Joystick
- HMC5883L
- Sensor
- XBee
- Protocols
- Terminal
- OLED
- Serial LCD
- Communicate
- Pin states
- Functions
- Variables
- Values
- Strings
- Numbers
- Operators
- Control
-
Analog / Pulses
- 4×4 Keypad Wiring & Example Code
- About Naming Things
- Air Quality BME680
- Badge Display
- 4 x 4 Keypad
- ColorPal Wiring & Code Example
- Sound Impact Wiring & Example Code
- GPS Wiring & Example Code
- PIR Wiring & Example Code
- About BlocklyProp Updates
- Badge LEDs
- Badge Lock
- Joystick Wiring & Example Code
- Fingerprint Scanner Wiring & Example Code
- About Multicore
- Temperature & Humidity Sensor Wiring & Example Code
- Memsic 2125 Wiring & Example Code
- GPS
- System
- Badge Buttons
- PING))) Wiring & Example Code
- RFID Wiring & Example Code
- Graph
- Temp & Humidity
- BlocklyProp Bulk Project Download
- About Board Types
- LIS3DH Accelerometer
- ePaper
- IR Remote Wiring & Example Code
- Fingerprint Scanner
- Arrays
- Advanced WX
- Simple WX
- WX WiFi
- RGB LEDs
- LSM9DS1 9-axis IMU
- Robot
- PWM
- Pulse in / out
- Voltage
- RC time
- Servo
- Audio
- Analog / Pulses
- Memory
- ColorPal
- Sound Impact Sensor
- Sony Remote
- RFID
- PIR
- Ping))) Distance
- MMA7455
- Memsic 2-axis
- 2-Axis Joystick
- HMC5883L
- Sensor
- XBee
- Protocols
- Terminal
- OLED
- Serial LCD
- Communicate
- Pin states
- Functions
- Variables
- Values
- Strings
- Numbers
- Operators
- Control
-
Memory
- 4×4 Keypad Wiring & Example Code
- About Naming Things
- Air Quality BME680
- Badge Display
- 4 x 4 Keypad
- ColorPal Wiring & Code Example
- Sound Impact Wiring & Example Code
- GPS Wiring & Example Code
- PIR Wiring & Example Code
- About BlocklyProp Updates
- Badge LEDs
- Badge Lock
- Joystick Wiring & Example Code
- Fingerprint Scanner Wiring & Example Code
- About Multicore
- Temperature & Humidity Sensor Wiring & Example Code
- Memsic 2125 Wiring & Example Code
- GPS
- System
- Badge Buttons
- PING))) Wiring & Example Code
- RFID Wiring & Example Code
- Graph
- Temp & Humidity
- BlocklyProp Bulk Project Download
- About Board Types
- LIS3DH Accelerometer
- ePaper
- IR Remote Wiring & Example Code
- Fingerprint Scanner
- Arrays
- Advanced WX
- Simple WX
- WX WiFi
- RGB LEDs
- LSM9DS1 9-axis IMU
- Robot
- PWM
- Pulse in / out
- Voltage
- RC time
- Servo
- Audio
- Analog / Pulses
- Memory
- ColorPal
- Sound Impact Sensor
- Sony Remote
- RFID
- PIR
- Ping))) Distance
- MMA7455
- Memsic 2-axis
- 2-Axis Joystick
- HMC5883L
- Sensor
- XBee
- Protocols
- Terminal
- OLED
- Serial LCD
- Communicate
- Pin states
- Functions
- Variables
- Values
- Strings
- Numbers
- Operators
- Control
-
ColorPal
- 4×4 Keypad Wiring & Example Code
- About Naming Things
- Air Quality BME680
- Badge Display
- 4 x 4 Keypad
- ColorPal Wiring & Code Example
- Sound Impact Wiring & Example Code
- GPS Wiring & Example Code
- PIR Wiring & Example Code
- About BlocklyProp Updates
- Badge LEDs
- Badge Lock
- Joystick Wiring & Example Code
- Fingerprint Scanner Wiring & Example Code
- About Multicore
- Temperature & Humidity Sensor Wiring & Example Code
- Memsic 2125 Wiring & Example Code
- GPS
- System
- Badge Buttons
- PING))) Wiring & Example Code
- RFID Wiring & Example Code
- Graph
- Temp & Humidity
- BlocklyProp Bulk Project Download
- About Board Types
- LIS3DH Accelerometer
- ePaper
- IR Remote Wiring & Example Code
- Fingerprint Scanner
- Arrays
- Advanced WX
- Simple WX
- WX WiFi
- RGB LEDs
- LSM9DS1 9-axis IMU
- Robot
- PWM
- Pulse in / out
- Voltage
- RC time
- Servo
- Audio
- Analog / Pulses
- Memory
- ColorPal
- Sound Impact Sensor
- Sony Remote
- RFID
- PIR
- Ping))) Distance
- MMA7455
- Memsic 2-axis
- 2-Axis Joystick
- HMC5883L
- Sensor
- XBee
- Protocols
- Terminal
- OLED
- Serial LCD
- Communicate
- Pin states
- Functions
- Variables
- Values
- Strings
- Numbers
- Operators
- Control
-
Sound Impact Sensor
- 4×4 Keypad Wiring & Example Code
- About Naming Things
- Air Quality BME680
- Badge Display
- 4 x 4 Keypad
- ColorPal Wiring & Code Example
- Sound Impact Wiring & Example Code
- GPS Wiring & Example Code
- PIR Wiring & Example Code
- About BlocklyProp Updates
- Badge LEDs
- Badge Lock
- Joystick Wiring & Example Code
- Fingerprint Scanner Wiring & Example Code
- About Multicore
- Temperature & Humidity Sensor Wiring & Example Code
- Memsic 2125 Wiring & Example Code
- GPS
- System
- Badge Buttons
- PING))) Wiring & Example Code
- RFID Wiring & Example Code
- Graph
- Temp & Humidity
- BlocklyProp Bulk Project Download
- About Board Types
- LIS3DH Accelerometer
- ePaper
- IR Remote Wiring & Example Code
- Fingerprint Scanner
- Arrays
- Advanced WX
- Simple WX
- WX WiFi
- RGB LEDs
- LSM9DS1 9-axis IMU
- Robot
- PWM
- Pulse in / out
- Voltage
- RC time
- Servo
- Audio
- Analog / Pulses
- Memory
- ColorPal
- Sound Impact Sensor
- Sony Remote
- RFID
- PIR
- Ping))) Distance
- MMA7455
- Memsic 2-axis
- 2-Axis Joystick
- HMC5883L
- Sensor
- XBee
- Protocols
- Terminal
- OLED
- Serial LCD
- Communicate
- Pin states
- Functions
- Variables
- Values
- Strings
- Numbers
- Operators
- Control
-
Sony Remote
- 4×4 Keypad Wiring & Example Code
- About Naming Things
- Air Quality BME680
- Badge Display
- 4 x 4 Keypad
- ColorPal Wiring & Code Example
- Sound Impact Wiring & Example Code
- GPS Wiring & Example Code
- PIR Wiring & Example Code
- About BlocklyProp Updates
- Badge LEDs
- Badge Lock
- Joystick Wiring & Example Code
- Fingerprint Scanner Wiring & Example Code
- About Multicore
- Temperature & Humidity Sensor Wiring & Example Code
- Memsic 2125 Wiring & Example Code
- GPS
- System
- Badge Buttons
- PING))) Wiring & Example Code
- RFID Wiring & Example Code
- Graph
- Temp & Humidity
- BlocklyProp Bulk Project Download
- About Board Types
- LIS3DH Accelerometer
- ePaper
- IR Remote Wiring & Example Code
- Fingerprint Scanner
- Arrays
- Advanced WX
- Simple WX
- WX WiFi
- RGB LEDs
- LSM9DS1 9-axis IMU
- Robot
- PWM
- Pulse in / out
- Voltage
- RC time
- Servo
- Audio
- Analog / Pulses
- Memory
- ColorPal
- Sound Impact Sensor
- Sony Remote
- RFID
- PIR
- Ping))) Distance
- MMA7455
- Memsic 2-axis
- 2-Axis Joystick
- HMC5883L
- Sensor
- XBee
- Protocols
- Terminal
- OLED
- Serial LCD
- Communicate
- Pin states
- Functions
- Variables
- Values
- Strings
- Numbers
- Operators
- Control
-
RFID
- 4×4 Keypad Wiring & Example Code
- About Naming Things
- Air Quality BME680
- Badge Display
- 4 x 4 Keypad
- ColorPal Wiring & Code Example
- Sound Impact Wiring & Example Code
- GPS Wiring & Example Code
- PIR Wiring & Example Code
- About BlocklyProp Updates
- Badge LEDs
- Badge Lock
- Joystick Wiring & Example Code
- Fingerprint Scanner Wiring & Example Code
- About Multicore
- Temperature & Humidity Sensor Wiring & Example Code
- Memsic 2125 Wiring & Example Code
- GPS
- System
- Badge Buttons
- PING))) Wiring & Example Code
- RFID Wiring & Example Code
- Graph
- Temp & Humidity
- BlocklyProp Bulk Project Download
- About Board Types
- LIS3DH Accelerometer
- ePaper
- IR Remote Wiring & Example Code
- Fingerprint Scanner
- Arrays
- Advanced WX
- Simple WX
- WX WiFi
- RGB LEDs
- LSM9DS1 9-axis IMU
- Robot
- PWM
- Pulse in / out
- Voltage
- RC time
- Servo
- Audio
- Analog / Pulses
- Memory
- ColorPal
- Sound Impact Sensor
- Sony Remote
- RFID
- PIR
- Ping))) Distance
- MMA7455
- Memsic 2-axis
- 2-Axis Joystick
- HMC5883L
- Sensor
- XBee
- Protocols
- Terminal
- OLED
- Serial LCD
- Communicate
- Pin states
- Functions
- Variables
- Values
- Strings
- Numbers
- Operators
- Control
-
PIR
- 4×4 Keypad Wiring & Example Code
- About Naming Things
- Air Quality BME680
- Badge Display
- 4 x 4 Keypad
- ColorPal Wiring & Code Example
- Sound Impact Wiring & Example Code
- GPS Wiring & Example Code
- PIR Wiring & Example Code
- About BlocklyProp Updates
- Badge LEDs
- Badge Lock
- Joystick Wiring & Example Code
- Fingerprint Scanner Wiring & Example Code
- About Multicore
- Temperature & Humidity Sensor Wiring & Example Code
- Memsic 2125 Wiring & Example Code
- GPS
- System
- Badge Buttons
- PING))) Wiring & Example Code
- RFID Wiring & Example Code
- Graph
- Temp & Humidity
- BlocklyProp Bulk Project Download
- About Board Types
- LIS3DH Accelerometer
- ePaper
- IR Remote Wiring & Example Code
- Fingerprint Scanner
- Arrays
- Advanced WX
- Simple WX
- WX WiFi
- RGB LEDs
- LSM9DS1 9-axis IMU
- Robot
- PWM
- Pulse in / out
- Voltage
- RC time
- Servo
- Audio
- Analog / Pulses
- Memory
- ColorPal
- Sound Impact Sensor
- Sony Remote
- RFID
- PIR
- Ping))) Distance
- MMA7455
- Memsic 2-axis
- 2-Axis Joystick
- HMC5883L
- Sensor
- XBee
- Protocols
- Terminal
- OLED
- Serial LCD
- Communicate
- Pin states
- Functions
- Variables
- Values
- Strings
- Numbers
- Operators
- Control
-
Ping))) Distance
- 4×4 Keypad Wiring & Example Code
- About Naming Things
- Air Quality BME680
- Badge Display
- 4 x 4 Keypad
- ColorPal Wiring & Code Example
- Sound Impact Wiring & Example Code
- GPS Wiring & Example Code
- PIR Wiring & Example Code
- About BlocklyProp Updates
- Badge LEDs
- Badge Lock
- Joystick Wiring & Example Code
- Fingerprint Scanner Wiring & Example Code
- About Multicore
- Temperature & Humidity Sensor Wiring & Example Code
- Memsic 2125 Wiring & Example Code
- GPS
- System
- Badge Buttons
- PING))) Wiring & Example Code
- RFID Wiring & Example Code
- Graph
- Temp & Humidity
- BlocklyProp Bulk Project Download
- About Board Types
- LIS3DH Accelerometer
- ePaper
- IR Remote Wiring & Example Code
- Fingerprint Scanner
- Arrays
- Advanced WX
- Simple WX
- WX WiFi
- RGB LEDs
- LSM9DS1 9-axis IMU
- Robot
- PWM
- Pulse in / out
- Voltage
- RC time
- Servo
- Audio
- Analog / Pulses
- Memory
- ColorPal
- Sound Impact Sensor
- Sony Remote
- RFID
- PIR
- Ping))) Distance
- MMA7455
- Memsic 2-axis
- 2-Axis Joystick
- HMC5883L
- Sensor
- XBee
- Protocols
- Terminal
- OLED
- Serial LCD
- Communicate
- Pin states
- Functions
- Variables
- Values
- Strings
- Numbers
- Operators
- Control
-
MMA7455
- 4×4 Keypad Wiring & Example Code
- About Naming Things
- Air Quality BME680
- Badge Display
- 4 x 4 Keypad
- ColorPal Wiring & Code Example
- Sound Impact Wiring & Example Code
- GPS Wiring & Example Code
- PIR Wiring & Example Code
- About BlocklyProp Updates
- Badge LEDs
- Badge Lock
- Joystick Wiring & Example Code
- Fingerprint Scanner Wiring & Example Code
- About Multicore
- Temperature & Humidity Sensor Wiring & Example Code
- Memsic 2125 Wiring & Example Code
- GPS
- System
- Badge Buttons
- PING))) Wiring & Example Code
- RFID Wiring & Example Code
- Graph
- Temp & Humidity
- BlocklyProp Bulk Project Download
- About Board Types
- LIS3DH Accelerometer
- ePaper
- IR Remote Wiring & Example Code
- Fingerprint Scanner
- Arrays
- Advanced WX
- Simple WX
- WX WiFi
- RGB LEDs
- LSM9DS1 9-axis IMU
- Robot
- PWM
- Pulse in / out
- Voltage
- RC time
- Servo
- Audio
- Analog / Pulses
- Memory
- ColorPal
- Sound Impact Sensor
- Sony Remote
- RFID
- PIR
- Ping))) Distance
- MMA7455
- Memsic 2-axis
- 2-Axis Joystick
- HMC5883L
- Sensor
- XBee
- Protocols
- Terminal
- OLED
- Serial LCD
- Communicate
- Pin states
- Functions
- Variables
- Values
- Strings
- Numbers
- Operators
- Control
-
Memsic 2-axis
- 4×4 Keypad Wiring & Example Code
- About Naming Things
- Air Quality BME680
- Badge Display
- 4 x 4 Keypad
- ColorPal Wiring & Code Example
- Sound Impact Wiring & Example Code
- GPS Wiring & Example Code
- PIR Wiring & Example Code
- About BlocklyProp Updates
- Badge LEDs
- Badge Lock
- Joystick Wiring & Example Code
- Fingerprint Scanner Wiring & Example Code
- About Multicore
- Temperature & Humidity Sensor Wiring & Example Code
- Memsic 2125 Wiring & Example Code
- GPS
- System
- Badge Buttons
- PING))) Wiring & Example Code
- RFID Wiring & Example Code
- Graph
- Temp & Humidity
- BlocklyProp Bulk Project Download
- About Board Types
- LIS3DH Accelerometer
- ePaper
- IR Remote Wiring & Example Code
- Fingerprint Scanner
- Arrays
- Advanced WX
- Simple WX
- WX WiFi
- RGB LEDs
- LSM9DS1 9-axis IMU
- Robot
- PWM
- Pulse in / out
- Voltage
- RC time
- Servo
- Audio
- Analog / Pulses
- Memory
- ColorPal
- Sound Impact Sensor
- Sony Remote
- RFID
- PIR
- Ping))) Distance
- MMA7455
- Memsic 2-axis
- 2-Axis Joystick
- HMC5883L
- Sensor
- XBee
- Protocols
- Terminal
- OLED
- Serial LCD
- Communicate
- Pin states
- Functions
- Variables
- Values
- Strings
- Numbers
- Operators
- Control
-
2-Axis Joystick
- 4×4 Keypad Wiring & Example Code
- About Naming Things
- Air Quality BME680
- Badge Display
- 4 x 4 Keypad
- ColorPal Wiring & Code Example
- Sound Impact Wiring & Example Code
- GPS Wiring & Example Code
- PIR Wiring & Example Code
- About BlocklyProp Updates
- Badge LEDs
- Badge Lock
- Joystick Wiring & Example Code
- Fingerprint Scanner Wiring & Example Code
- About Multicore
- Temperature & Humidity Sensor Wiring & Example Code
- Memsic 2125 Wiring & Example Code
- GPS
- System
- Badge Buttons
- PING))) Wiring & Example Code
- RFID Wiring & Example Code
- Graph
- Temp & Humidity
- BlocklyProp Bulk Project Download
- About Board Types
- LIS3DH Accelerometer
- ePaper
- IR Remote Wiring & Example Code
- Fingerprint Scanner
- Arrays
- Advanced WX
- Simple WX
- WX WiFi
- RGB LEDs
- LSM9DS1 9-axis IMU
- Robot
- PWM
- Pulse in / out
- Voltage
- RC time
- Servo
- Audio
- Analog / Pulses
- Memory
- ColorPal
- Sound Impact Sensor
- Sony Remote
- RFID
- PIR
- Ping))) Distance
- MMA7455
- Memsic 2-axis
- 2-Axis Joystick
- HMC5883L
- Sensor
- XBee
- Protocols
- Terminal
- OLED
- Serial LCD
- Communicate
- Pin states
- Functions
- Variables
- Values
- Strings
- Numbers
- Operators
- Control
-
HMC5883L
- 4×4 Keypad Wiring & Example Code
- About Naming Things
- Air Quality BME680
- Badge Display
- 4 x 4 Keypad
- ColorPal Wiring & Code Example
- Sound Impact Wiring & Example Code
- GPS Wiring & Example Code
- PIR Wiring & Example Code
- About BlocklyProp Updates
- Badge LEDs
- Badge Lock
- Joystick Wiring & Example Code
- Fingerprint Scanner Wiring & Example Code
- About Multicore
- Temperature & Humidity Sensor Wiring & Example Code
- Memsic 2125 Wiring & Example Code
- GPS
- System
- Badge Buttons
- PING))) Wiring & Example Code
- RFID Wiring & Example Code
- Graph
- Temp & Humidity
- BlocklyProp Bulk Project Download
- About Board Types
- LIS3DH Accelerometer
- ePaper
- IR Remote Wiring & Example Code
- Fingerprint Scanner
- Arrays
- Advanced WX
- Simple WX
- WX WiFi
- RGB LEDs
- LSM9DS1 9-axis IMU
- Robot
- PWM
- Pulse in / out
- Voltage
- RC time
- Servo
- Audio
- Analog / Pulses
- Memory
- ColorPal
- Sound Impact Sensor
- Sony Remote
- RFID
- PIR
- Ping))) Distance
- MMA7455
- Memsic 2-axis
- 2-Axis Joystick
- HMC5883L
- Sensor
- XBee
- Protocols
- Terminal
- OLED
- Serial LCD
- Communicate
- Pin states
- Functions
- Variables
- Values
- Strings
- Numbers
- Operators
- Control
-
Sensor
- 4×4 Keypad Wiring & Example Code
- About Naming Things
- Air Quality BME680
- Badge Display
- 4 x 4 Keypad
- ColorPal Wiring & Code Example
- Sound Impact Wiring & Example Code
- GPS Wiring & Example Code
- PIR Wiring & Example Code
- About BlocklyProp Updates
- Badge LEDs
- Badge Lock
- Joystick Wiring & Example Code
- Fingerprint Scanner Wiring & Example Code
- About Multicore
- Temperature & Humidity Sensor Wiring & Example Code
- Memsic 2125 Wiring & Example Code
- GPS
- System
- Badge Buttons
- PING))) Wiring & Example Code
- RFID Wiring & Example Code
- Graph
- Temp & Humidity
- BlocklyProp Bulk Project Download
- About Board Types
- LIS3DH Accelerometer
- ePaper
- IR Remote Wiring & Example Code
- Fingerprint Scanner
- Arrays
- Advanced WX
- Simple WX
- WX WiFi
- RGB LEDs
- LSM9DS1 9-axis IMU
- Robot
- PWM
- Pulse in / out
- Voltage
- RC time
- Servo
- Audio
- Analog / Pulses
- Memory
- ColorPal
- Sound Impact Sensor
- Sony Remote
- RFID
- PIR
- Ping))) Distance
- MMA7455
- Memsic 2-axis
- 2-Axis Joystick
- HMC5883L
- Sensor
- XBee
- Protocols
- Terminal
- OLED
- Serial LCD
- Communicate
- Pin states
- Functions
- Variables
- Values
- Strings
- Numbers
- Operators
- Control
-
XBee
- 4×4 Keypad Wiring & Example Code
- About Naming Things
- Air Quality BME680
- Badge Display
- 4 x 4 Keypad
- ColorPal Wiring & Code Example
- Sound Impact Wiring & Example Code
- GPS Wiring & Example Code
- PIR Wiring & Example Code
- About BlocklyProp Updates
- Badge LEDs
- Badge Lock
- Joystick Wiring & Example Code
- Fingerprint Scanner Wiring & Example Code
- About Multicore
- Temperature & Humidity Sensor Wiring & Example Code
- Memsic 2125 Wiring & Example Code
- GPS
- System
- Badge Buttons
- PING))) Wiring & Example Code
- RFID Wiring & Example Code
- Graph
- Temp & Humidity
- BlocklyProp Bulk Project Download
- About Board Types
- LIS3DH Accelerometer
- ePaper
- IR Remote Wiring & Example Code
- Fingerprint Scanner
- Arrays
- Advanced WX
- Simple WX
- WX WiFi
- RGB LEDs
- LSM9DS1 9-axis IMU
- Robot
- PWM
- Pulse in / out
- Voltage
- RC time
- Servo
- Audio
- Analog / Pulses
- Memory
- ColorPal
- Sound Impact Sensor
- Sony Remote
- RFID
- PIR
- Ping))) Distance
- MMA7455
- Memsic 2-axis
- 2-Axis Joystick
- HMC5883L
- Sensor
- XBee
- Protocols
- Terminal
- OLED
- Serial LCD
- Communicate
- Pin states
- Functions
- Variables
- Values
- Strings
- Numbers
- Operators
- Control
-
Protocols
- 4×4 Keypad Wiring & Example Code
- About Naming Things
- Air Quality BME680
- Badge Display
- 4 x 4 Keypad
- ColorPal Wiring & Code Example
- Sound Impact Wiring & Example Code
- GPS Wiring & Example Code
- PIR Wiring & Example Code
- About BlocklyProp Updates
- Badge LEDs
- Badge Lock
- Joystick Wiring & Example Code
- Fingerprint Scanner Wiring & Example Code
- About Multicore
- Temperature & Humidity Sensor Wiring & Example Code
- Memsic 2125 Wiring & Example Code
- GPS
- System
- Badge Buttons
- PING))) Wiring & Example Code
- RFID Wiring & Example Code
- Graph
- Temp & Humidity
- BlocklyProp Bulk Project Download
- About Board Types
- LIS3DH Accelerometer
- ePaper
- IR Remote Wiring & Example Code
- Fingerprint Scanner
- Arrays
- Advanced WX
- Simple WX
- WX WiFi
- RGB LEDs
- LSM9DS1 9-axis IMU
- Robot
- PWM
- Pulse in / out
- Voltage
- RC time
- Servo
- Audio
- Analog / Pulses
- Memory
- ColorPal
- Sound Impact Sensor
- Sony Remote
- RFID
- PIR
- Ping))) Distance
- MMA7455
- Memsic 2-axis
- 2-Axis Joystick
- HMC5883L
- Sensor
- XBee
- Protocols
- Terminal
- OLED
- Serial LCD
- Communicate
- Pin states
- Functions
- Variables
- Values
- Strings
- Numbers
- Operators
- Control
-
Terminal
- 4×4 Keypad Wiring & Example Code
- About Naming Things
- Air Quality BME680
- Badge Display
- 4 x 4 Keypad
- ColorPal Wiring & Code Example
- Sound Impact Wiring & Example Code
- GPS Wiring & Example Code
- PIR Wiring & Example Code
- About BlocklyProp Updates
- Badge LEDs
- Badge Lock
- Joystick Wiring & Example Code
- Fingerprint Scanner Wiring & Example Code
- About Multicore
- Temperature & Humidity Sensor Wiring & Example Code
- Memsic 2125 Wiring & Example Code
- GPS
- System
- Badge Buttons
- PING))) Wiring & Example Code
- RFID Wiring & Example Code
- Graph
- Temp & Humidity
- BlocklyProp Bulk Project Download
- About Board Types
- LIS3DH Accelerometer
- ePaper
- IR Remote Wiring & Example Code
- Fingerprint Scanner
- Arrays
- Advanced WX
- Simple WX
- WX WiFi
- RGB LEDs
- LSM9DS1 9-axis IMU
- Robot
- PWM
- Pulse in / out
- Voltage
- RC time
- Servo
- Audio
- Analog / Pulses
- Memory
- ColorPal
- Sound Impact Sensor
- Sony Remote
- RFID
- PIR
- Ping))) Distance
- MMA7455
- Memsic 2-axis
- 2-Axis Joystick
- HMC5883L
- Sensor
- XBee
- Protocols
- Terminal
- OLED
- Serial LCD
- Communicate
- Pin states
- Functions
- Variables
- Values
- Strings
- Numbers
- Operators
- Control
-
OLED
- 4×4 Keypad Wiring & Example Code
- About Naming Things
- Air Quality BME680
- Badge Display
- 4 x 4 Keypad
- ColorPal Wiring & Code Example
- Sound Impact Wiring & Example Code
- GPS Wiring & Example Code
- PIR Wiring & Example Code
- About BlocklyProp Updates
- Badge LEDs
- Badge Lock
- Joystick Wiring & Example Code
- Fingerprint Scanner Wiring & Example Code
- About Multicore
- Temperature & Humidity Sensor Wiring & Example Code
- Memsic 2125 Wiring & Example Code
- GPS
- System
- Badge Buttons
- PING))) Wiring & Example Code
- RFID Wiring & Example Code
- Graph
- Temp & Humidity
- BlocklyProp Bulk Project Download
- About Board Types
- LIS3DH Accelerometer
- ePaper
- IR Remote Wiring & Example Code
- Fingerprint Scanner
- Arrays
- Advanced WX
- Simple WX
- WX WiFi
- RGB LEDs
- LSM9DS1 9-axis IMU
- Robot
- PWM
- Pulse in / out
- Voltage
- RC time
- Servo
- Audio
- Analog / Pulses
- Memory
- ColorPal
- Sound Impact Sensor
- Sony Remote
- RFID
- PIR
- Ping))) Distance
- MMA7455
- Memsic 2-axis
- 2-Axis Joystick
- HMC5883L
- Sensor
- XBee
- Protocols
- Terminal
- OLED
- Serial LCD
- Communicate
- Pin states
- Functions
- Variables
- Values
- Strings
- Numbers
- Operators
- Control
-
Serial LCD
- 4×4 Keypad Wiring & Example Code
- About Naming Things
- Air Quality BME680
- Badge Display
- 4 x 4 Keypad
- ColorPal Wiring & Code Example
- Sound Impact Wiring & Example Code
- GPS Wiring & Example Code
- PIR Wiring & Example Code
- About BlocklyProp Updates
- Badge LEDs
- Badge Lock
- Joystick Wiring & Example Code
- Fingerprint Scanner Wiring & Example Code
- About Multicore
- Temperature & Humidity Sensor Wiring & Example Code
- Memsic 2125 Wiring & Example Code
- GPS
- System
- Badge Buttons
- PING))) Wiring & Example Code
- RFID Wiring & Example Code
- Graph
- Temp & Humidity
- BlocklyProp Bulk Project Download
- About Board Types
- LIS3DH Accelerometer
- ePaper
- IR Remote Wiring & Example Code
- Fingerprint Scanner
- Arrays
- Advanced WX
- Simple WX
- WX WiFi
- RGB LEDs
- LSM9DS1 9-axis IMU
- Robot
- PWM
- Pulse in / out
- Voltage
- RC time
- Servo
- Audio
- Analog / Pulses
- Memory
- ColorPal
- Sound Impact Sensor
- Sony Remote
- RFID
- PIR
- Ping))) Distance
- MMA7455
- Memsic 2-axis
- 2-Axis Joystick
- HMC5883L
- Sensor
- XBee
- Protocols
- Terminal
- OLED
- Serial LCD
- Communicate
- Pin states
- Functions
- Variables
- Values
- Strings
- Numbers
- Operators
- Control
-
Communicate
- 4×4 Keypad Wiring & Example Code
- About Naming Things
- Air Quality BME680
- Badge Display
- 4 x 4 Keypad
- ColorPal Wiring & Code Example
- Sound Impact Wiring & Example Code
- GPS Wiring & Example Code
- PIR Wiring & Example Code
- About BlocklyProp Updates
- Badge LEDs
- Badge Lock
- Joystick Wiring & Example Code
- Fingerprint Scanner Wiring & Example Code
- About Multicore
- Temperature & Humidity Sensor Wiring & Example Code
- Memsic 2125 Wiring & Example Code
- GPS
- System
- Badge Buttons
- PING))) Wiring & Example Code
- RFID Wiring & Example Code
- Graph
- Temp & Humidity
- BlocklyProp Bulk Project Download
- About Board Types
- LIS3DH Accelerometer
- ePaper
- IR Remote Wiring & Example Code
- Fingerprint Scanner
- Arrays
- Advanced WX
- Simple WX
- WX WiFi
- RGB LEDs
- LSM9DS1 9-axis IMU
- Robot
- PWM
- Pulse in / out
- Voltage
- RC time
- Servo
- Audio
- Analog / Pulses
- Memory
- ColorPal
- Sound Impact Sensor
- Sony Remote
- RFID
- PIR
- Ping))) Distance
- MMA7455
- Memsic 2-axis
- 2-Axis Joystick
- HMC5883L
- Sensor
- XBee
- Protocols
- Terminal
- OLED
- Serial LCD
- Communicate
- Pin states
- Functions
- Variables
- Values
- Strings
- Numbers
- Operators
- Control
-
Pin states
- 4×4 Keypad Wiring & Example Code
- About Naming Things
- Air Quality BME680
- Badge Display
- 4 x 4 Keypad
- ColorPal Wiring & Code Example
- Sound Impact Wiring & Example Code
- GPS Wiring & Example Code
- PIR Wiring & Example Code
- About BlocklyProp Updates
- Badge LEDs
- Badge Lock
- Joystick Wiring & Example Code
- Fingerprint Scanner Wiring & Example Code
- About Multicore
- Temperature & Humidity Sensor Wiring & Example Code
- Memsic 2125 Wiring & Example Code
- GPS
- System
- Badge Buttons
- PING))) Wiring & Example Code
- RFID Wiring & Example Code
- Graph
- Temp & Humidity
- BlocklyProp Bulk Project Download
- About Board Types
- LIS3DH Accelerometer
- ePaper
- IR Remote Wiring & Example Code
- Fingerprint Scanner
- Arrays
- Advanced WX
- Simple WX
- WX WiFi
- RGB LEDs
- LSM9DS1 9-axis IMU
- Robot
- PWM
- Pulse in / out
- Voltage
- RC time
- Servo
- Audio
- Analog / Pulses
- Memory
- ColorPal
- Sound Impact Sensor
- Sony Remote
- RFID
- PIR
- Ping))) Distance
- MMA7455
- Memsic 2-axis
- 2-Axis Joystick
- HMC5883L
- Sensor
- XBee
- Protocols
- Terminal
- OLED
- Serial LCD
- Communicate
- Pin states
- Functions
- Variables
- Values
- Strings
- Numbers
- Operators
- Control
-
Functions
- 4×4 Keypad Wiring & Example Code
- About Naming Things
- Air Quality BME680
- Badge Display
- 4 x 4 Keypad
- ColorPal Wiring & Code Example
- Sound Impact Wiring & Example Code
- GPS Wiring & Example Code
- PIR Wiring & Example Code
- About BlocklyProp Updates
- Badge LEDs
- Badge Lock
- Joystick Wiring & Example Code
- Fingerprint Scanner Wiring & Example Code
- About Multicore
- Temperature & Humidity Sensor Wiring & Example Code
- Memsic 2125 Wiring & Example Code
- GPS
- System
- Badge Buttons
- PING))) Wiring & Example Code
- RFID Wiring & Example Code
- Graph
- Temp & Humidity
- BlocklyProp Bulk Project Download
- About Board Types
- LIS3DH Accelerometer
- ePaper
- IR Remote Wiring & Example Code
- Fingerprint Scanner
- Arrays
- Advanced WX
- Simple WX
- WX WiFi
- RGB LEDs
- LSM9DS1 9-axis IMU
- Robot
- PWM
- Pulse in / out
- Voltage
- RC time
- Servo
- Audio
- Analog / Pulses
- Memory
- ColorPal
- Sound Impact Sensor
- Sony Remote
- RFID
- PIR
- Ping))) Distance
- MMA7455
- Memsic 2-axis
- 2-Axis Joystick
- HMC5883L
- Sensor
- XBee
- Protocols
- Terminal
- OLED
- Serial LCD
- Communicate
- Pin states
- Functions
- Variables
- Values
- Strings
- Numbers
- Operators
- Control
-
Variables
- 4×4 Keypad Wiring & Example Code
- About Naming Things
- Air Quality BME680
- Badge Display
- 4 x 4 Keypad
- ColorPal Wiring & Code Example
- Sound Impact Wiring & Example Code
- GPS Wiring & Example Code
- PIR Wiring & Example Code
- About BlocklyProp Updates
- Badge LEDs
- Badge Lock
- Joystick Wiring & Example Code
- Fingerprint Scanner Wiring & Example Code
- About Multicore
- Temperature & Humidity Sensor Wiring & Example Code
- Memsic 2125 Wiring & Example Code
- GPS
- System
- Badge Buttons
- PING))) Wiring & Example Code
- RFID Wiring & Example Code
- Graph
- Temp & Humidity
- BlocklyProp Bulk Project Download
- About Board Types
- LIS3DH Accelerometer
- ePaper
- IR Remote Wiring & Example Code
- Fingerprint Scanner
- Arrays
- Advanced WX
- Simple WX
- WX WiFi
- RGB LEDs
- LSM9DS1 9-axis IMU
- Robot
- PWM
- Pulse in / out
- Voltage
- RC time
- Servo
- Audio
- Analog / Pulses
- Memory
- ColorPal
- Sound Impact Sensor
- Sony Remote
- RFID
- PIR
- Ping))) Distance
- MMA7455
- Memsic 2-axis
- 2-Axis Joystick
- HMC5883L
- Sensor
- XBee
- Protocols
- Terminal
- OLED
- Serial LCD
- Communicate
- Pin states
- Functions
- Variables
- Values
- Strings
- Numbers
- Operators
- Control
-
Values
- 4×4 Keypad Wiring & Example Code
- About Naming Things
- Air Quality BME680
- Badge Display
- 4 x 4 Keypad
- ColorPal Wiring & Code Example
- Sound Impact Wiring & Example Code
- GPS Wiring & Example Code
- PIR Wiring & Example Code
- About BlocklyProp Updates
- Badge LEDs
- Badge Lock
- Joystick Wiring & Example Code
- Fingerprint Scanner Wiring & Example Code
- About Multicore
- Temperature & Humidity Sensor Wiring & Example Code
- Memsic 2125 Wiring & Example Code
- GPS
- System
- Badge Buttons
- PING))) Wiring & Example Code
- RFID Wiring & Example Code
- Graph
- Temp & Humidity
- BlocklyProp Bulk Project Download
- About Board Types
- LIS3DH Accelerometer
- ePaper
- IR Remote Wiring & Example Code
- Fingerprint Scanner
- Arrays
- Advanced WX
- Simple WX
- WX WiFi
- RGB LEDs
- LSM9DS1 9-axis IMU
- Robot
- PWM
- Pulse in / out
- Voltage
- RC time
- Servo
- Audio
- Analog / Pulses
- Memory
- ColorPal
- Sound Impact Sensor
- Sony Remote
- RFID
- PIR
- Ping))) Distance
- MMA7455
- Memsic 2-axis
- 2-Axis Joystick
- HMC5883L
- Sensor
- XBee
- Protocols
- Terminal
- OLED
- Serial LCD
- Communicate
- Pin states
- Functions
- Variables
- Values
- Strings
- Numbers
- Operators
- Control
-
Strings
- 4×4 Keypad Wiring & Example Code
- About Naming Things
- Air Quality BME680
- Badge Display
- 4 x 4 Keypad
- ColorPal Wiring & Code Example
- Sound Impact Wiring & Example Code
- GPS Wiring & Example Code
- PIR Wiring & Example Code
- About BlocklyProp Updates
- Badge LEDs
- Badge Lock
- Joystick Wiring & Example Code
- Fingerprint Scanner Wiring & Example Code
- About Multicore
- Temperature & Humidity Sensor Wiring & Example Code
- Memsic 2125 Wiring & Example Code
- GPS
- System
- Badge Buttons
- PING))) Wiring & Example Code
- RFID Wiring & Example Code
- Graph
- Temp & Humidity
- BlocklyProp Bulk Project Download
- About Board Types
- LIS3DH Accelerometer
- ePaper
- IR Remote Wiring & Example Code
- Fingerprint Scanner
- Arrays
- Advanced WX
- Simple WX
- WX WiFi
- RGB LEDs
- LSM9DS1 9-axis IMU
- Robot
- PWM
- Pulse in / out
- Voltage
- RC time
- Servo
- Audio
- Analog / Pulses
- Memory
- ColorPal
- Sound Impact Sensor
- Sony Remote
- RFID
- PIR
- Ping))) Distance
- MMA7455
- Memsic 2-axis
- 2-Axis Joystick
- HMC5883L
- Sensor
- XBee
- Protocols
- Terminal
- OLED
- Serial LCD
- Communicate
- Pin states
- Functions
- Variables
- Values
- Strings
- Numbers
- Operators
- Control
-
Numbers
- 4×4 Keypad Wiring & Example Code
- About Naming Things
- Air Quality BME680
- Badge Display
- 4 x 4 Keypad
- ColorPal Wiring & Code Example
- Sound Impact Wiring & Example Code
- GPS Wiring & Example Code
- PIR Wiring & Example Code
- About BlocklyProp Updates
- Badge LEDs
- Badge Lock
- Joystick Wiring & Example Code
- Fingerprint Scanner Wiring & Example Code
- About Multicore
- Temperature & Humidity Sensor Wiring & Example Code
- Memsic 2125 Wiring & Example Code
- GPS
- System
- Badge Buttons
- PING))) Wiring & Example Code
- RFID Wiring & Example Code
- Graph
- Temp & Humidity
- BlocklyProp Bulk Project Download
- About Board Types
- LIS3DH Accelerometer
- ePaper
- IR Remote Wiring & Example Code
- Fingerprint Scanner
- Arrays
- Advanced WX
- Simple WX
- WX WiFi
- RGB LEDs
- LSM9DS1 9-axis IMU
- Robot
- PWM
- Pulse in / out
- Voltage
- RC time
- Servo
- Audio
- Analog / Pulses
- Memory
- ColorPal
- Sound Impact Sensor
- Sony Remote
- RFID
- PIR
- Ping))) Distance
- MMA7455
- Memsic 2-axis
- 2-Axis Joystick
- HMC5883L
- Sensor
- XBee
- Protocols
- Terminal
- OLED
- Serial LCD
- Communicate
- Pin states
- Functions
- Variables
- Values
- Strings
- Numbers
- Operators
- Control
-
Operators
- 4×4 Keypad Wiring & Example Code
- About Naming Things
- Air Quality BME680
- Badge Display
- 4 x 4 Keypad
- ColorPal Wiring & Code Example
- Sound Impact Wiring & Example Code
- GPS Wiring & Example Code
- PIR Wiring & Example Code
- About BlocklyProp Updates
- Badge LEDs
- Badge Lock
- Joystick Wiring & Example Code
- Fingerprint Scanner Wiring & Example Code
- About Multicore
- Temperature & Humidity Sensor Wiring & Example Code
- Memsic 2125 Wiring & Example Code
- GPS
- System
- Badge Buttons
- PING))) Wiring & Example Code
- RFID Wiring & Example Code
- Graph
- Temp & Humidity
- BlocklyProp Bulk Project Download
- About Board Types
- LIS3DH Accelerometer
- ePaper
- IR Remote Wiring & Example Code
- Fingerprint Scanner
- Arrays
- Advanced WX
- Simple WX
- WX WiFi
- RGB LEDs
- LSM9DS1 9-axis IMU
- Robot
- PWM
- Pulse in / out
- Voltage
- RC time
- Servo
- Audio
- Analog / Pulses
- Memory
- ColorPal
- Sound Impact Sensor
- Sony Remote
- RFID
- PIR
- Ping))) Distance
- MMA7455
- Memsic 2-axis
- 2-Axis Joystick
- HMC5883L
- Sensor
- XBee
- Protocols
- Terminal
- OLED
- Serial LCD
- Communicate
- Pin states
- Functions
- Variables
- Values
- Strings
- Numbers
- Operators
- Control
-
Control
- 4×4 Keypad Wiring & Example Code
- About Naming Things
- Air Quality BME680
- Badge Display
- 4 x 4 Keypad
- ColorPal Wiring & Code Example
- Sound Impact Wiring & Example Code
- GPS Wiring & Example Code
- PIR Wiring & Example Code
- About BlocklyProp Updates
- Badge LEDs
- Badge Lock
- Joystick Wiring & Example Code
- Fingerprint Scanner Wiring & Example Code
- About Multicore
- Temperature & Humidity Sensor Wiring & Example Code
- Memsic 2125 Wiring & Example Code
- GPS
- System
- Badge Buttons
- PING))) Wiring & Example Code
- RFID Wiring & Example Code
- Graph
- Temp & Humidity
- BlocklyProp Bulk Project Download
- About Board Types
- LIS3DH Accelerometer
- ePaper
- IR Remote Wiring & Example Code
- Fingerprint Scanner
- Arrays
- Advanced WX
- Simple WX
- WX WiFi
- RGB LEDs
- LSM9DS1 9-axis IMU
- Robot
- PWM
- Pulse in / out
- Voltage
- RC time
- Servo
- Audio
- Analog / Pulses
- Memory
- ColorPal
- Sound Impact Sensor
- Sony Remote
- RFID
- PIR
- Ping))) Distance
- MMA7455
- Memsic 2-axis
- 2-Axis Joystick
- HMC5883L
- Sensor
- XBee
- Protocols
- Terminal
- OLED
- Serial LCD
- Communicate
- Pin states
- Functions
- Variables
- Values
- Strings
- Numbers
- Operators
- Control
Graph
BlocklyProp reference for GRAPH blocks


 For Propeller Activity Board WX (via USB connection only), Hackable Electronic Badge, FLiP, and Other board types.
The GRAPH blocks are used to generate a visual graph of data in BlocklyProp’s Graphing window. This window will open automatically when you run a project that uses these blocks.
Do not try to use Graph and Terminal blocks in the same project. The Terminal takes charge and will prevent the Graphing window from opening. You would, however, see some data values appear in the Terminal window.
Do not use the Graph blocks in a function that will be launched with the New Processor block. It won’t work – the Graph needs to be used from your project’s main processor.
- See the Graphing Data page of the Simple BlocklyProp Programs tutorial for an example project that doesn’t require any circuits.
- Watch the YouTube video below to see the Propeller Activity Board WX receive and graph data from an analog sensor.
]
Graph initialize


Use the Graph initialize block at the beginning of your project to set the display area for the data that your project will graph.
- keep selects the minimum number of seconds of the latest data to display in the graph at a time. As the display fills, you may see the horizontal division values change if your project continues to send data for longer than the value you enter here.
- y-axis selects a vertical scale option from the drop-down.
- autoscale allows the y-axis to continuously adjust to best fit your data; you may see the vertical division values change as your graph plots.
- range if selected will provide fields for entering minimum and maximum values.
Graph value

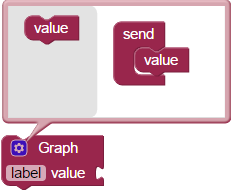
The Graph value block sends the attached value to the graph display. Click the gear to display additional values from the same block; you will be able to label each value. Each value plotted is a different color, with a matching label and numerical data displayed in a box in the Graphing window’s upper right corner.