This project demonstrates how to use the Parallax FLiP with a Memsic 2125 accelerometer to visually display two-axis incline using a moving bubble on the 0.95” OLED display. When you change the incline of the accelerometer you will see the yellow bubble indicator move on the OLED. The positive or negative degrees incline will also be shown on the OLED. Incline measurement has useful applications including physical therapy feedback, heavy equipment anti-rollover detection, robotics, digital level, and a slope indicator.
The programming concepts in this project show how a sensor may be continuously monitored in its own processor and how to use the OLED to show simple graphic images, precisely-positioned text and data values, and incline values without showing remnant characters.
The FLiP was chosen for this project because of its small size and lower cost. The Propeller Activity Board (regular or WX) will also work fine.
These items are available individually:
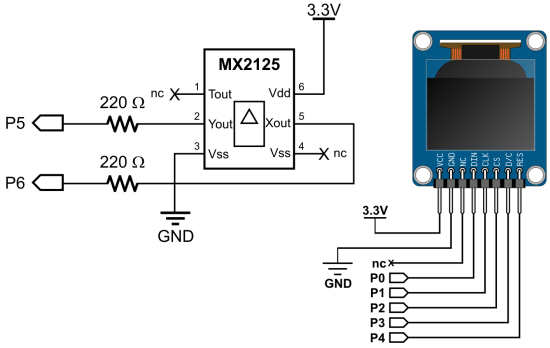
Use the schematics and pictures below to build the Tilt Bubble Display.
The source code is available for download from the link below:
Project3041-OLED-Memsic-FLiP.svg
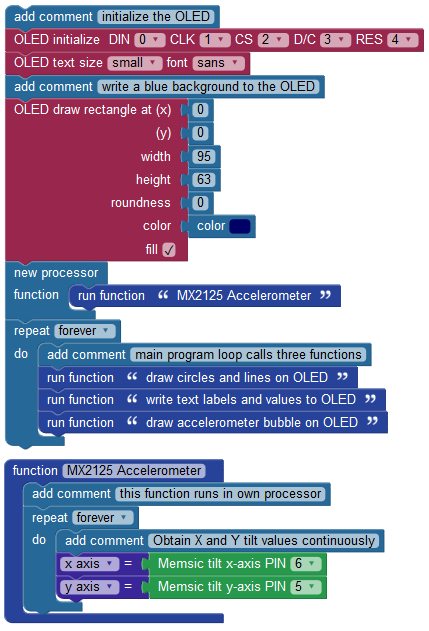
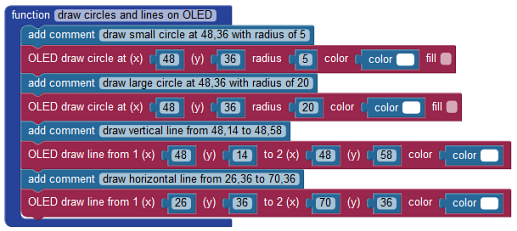
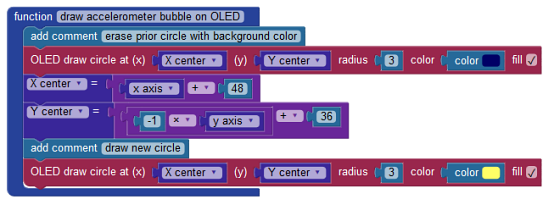
The Blockly program has several key sections. The program starts by configuring the OLED and filling it with a blue background. The function “MX2125 Accelerometer” starts in its own processor and runs continuously. The X and Y-axis incline values are stored in variables which are used to draw the yellow bubble on the OLED.
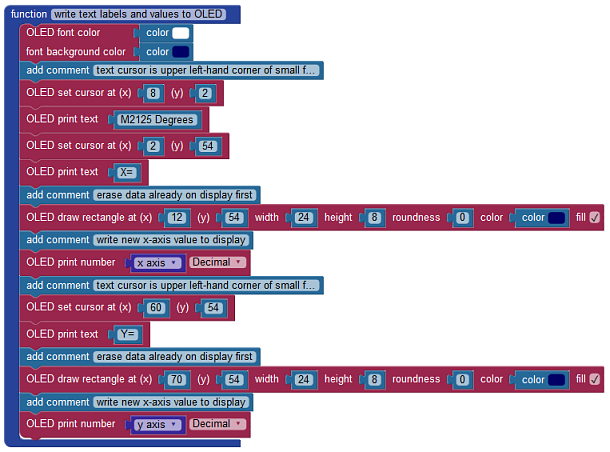
The repeat loop simply cycles through the following three functions:
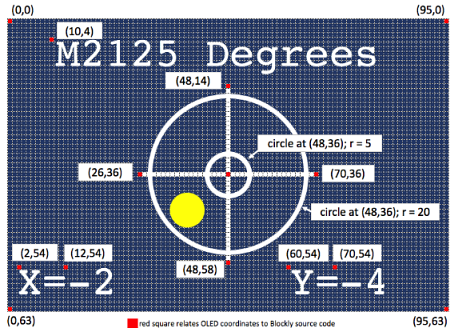
To understand how the OLED is updated we graphed the project on a 64×96 pixel space. Normal horizontal (x) and vertical (y) cartesian coordinate systems would place the (0,0) origin in the OLED’s lower left-hand corner. However, computer terminals and OLEDs are designed to place the origin in the upper left corner. The positive x increases to the right and y is downward.
The coordinates used in the Blockly code were plotted, pixel by pixel. The use of the OLED space worked out like this:
Two more considerations relative to coordinates are helpful to understand:
No lessons available for this course, displaying course content instead:
This project demonstrates how to use the Parallax FLiP with a Memsic 2125 accelerometer to visually display two-axis incline using a moving bubble on the 0.95” OLED display. When you change the incline of the accelerometer you will see the yellow bubble indicator move on the OLED. The positive or negative degrees incline will also be shown on the OLED. Incline measurement has useful applications including physical therapy feedback, heavy equipment anti-rollover detection, robotics, digital level, and a slope indicator.
The programming concepts in this project show how a sensor may be continuously monitored in its own processor and how to use the OLED to show simple graphic images, precisely-positioned text and data values, and incline values without showing remnant characters.
The FLiP was chosen for this project because of its small size and lower cost. The Propeller Activity Board (regular or WX) will also work fine.
These items are available individually:
Use the schematics and pictures below to build the Tilt Bubble Display.
The source code is available for download from the link below:
Project3041-OLED-Memsic-FLiP.svg
The Blockly program has several key sections. The program starts by configuring the OLED and filling it with a blue background. The function “MX2125 Accelerometer” starts in its own processor and runs continuously. The X and Y-axis incline values are stored in variables which are used to draw the yellow bubble on the OLED.
The repeat loop simply cycles through the following three functions:
To understand how the OLED is updated we graphed the project on a 64×96 pixel space. Normal horizontal (x) and vertical (y) cartesian coordinate systems would place the (0,0) origin in the OLED’s lower left-hand corner. However, computer terminals and OLEDs are designed to place the origin in the upper left corner. The positive x increases to the right and y is downward.
The coordinates used in the Blockly code were plotted, pixel by pixel. The use of the OLED space worked out like this:
Two more considerations relative to coordinates are helpful to understand:
