Get and Display Coordinates with a Program (Python)
In earlier lessons, you trained the HUSKYLENS and saved your training data to a microSD card.
Now you’ll display what the camera “sees” on the micro:bit’s 5×5 LED grid. The micro:bit will plot a moving dot showing the (X, Y) position of your trained color in the HUSKYLENS field of view. This activity is the first step toward making your robot respond to what it sees.
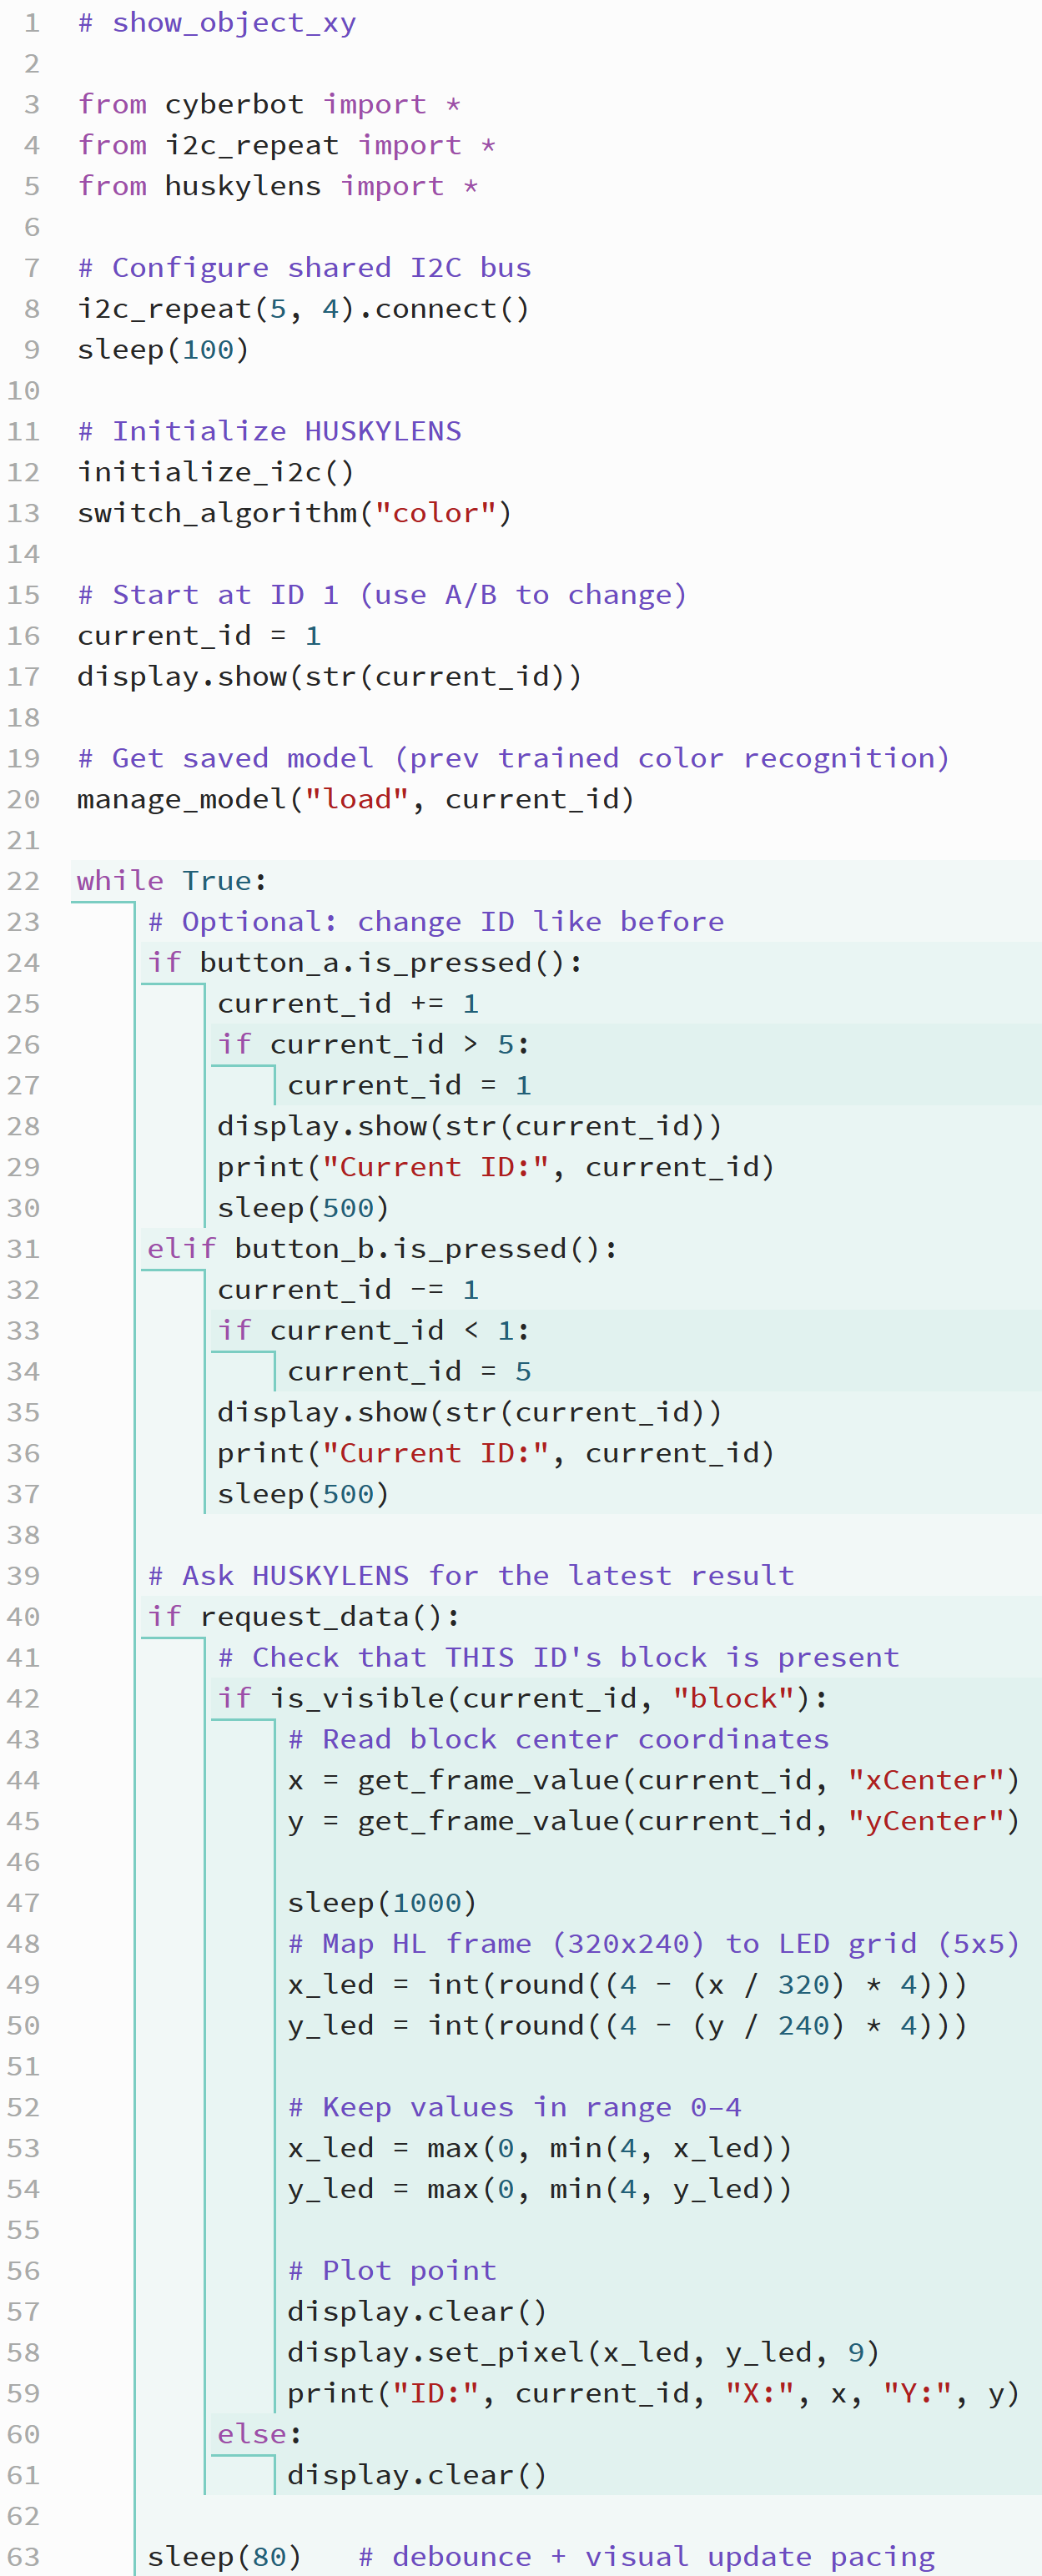
Script: show_object_xy
This script displays the position of your trained target on the micro:bit’s LED display as it appears in the HUSKYLENS view. NOTE: It does not use pixels on the outermost edges.
✓ Open the micro:bit Python Editor.
✓ Load your previous project (for example, learn_colors_with_microsd.
✓ Update the project name to show_object_xy.
✓ Replace the script contents with the code below.
✓ Click Save, then Send to micro:bit to flash it.
Tests
This activity builds directly on your Learn Colors work. Here, you’ll verify that the HUSKYLENS correctly reports X and Y coordinates for a trained color.
✓ Power up the cyber:bot with five fresh AA batteries.
✓ Confirm the battery barrel jack is connected.
✓ Set the 3-position PWR switch to 1 (center).
✓ Press A or B to select the ID of your trained color.
✓ Point the HUSKYLENS at that color.
✓ Watch the LED grid — a single dot should appear showing where the color is detected.
✓ Move the color left, right, up, and down; the LED dot should move correspondingly across the grid.
Note: If nothing is detected, the display will clear until the color is re-centered.
Try This
Experiment with the sleep(1000) on line 47. Reducing it will make the LED display more responsive to the object’s motions in the camera. Can you do without it, or will the application try to freeze?
Did You Know?
Mapping coordinates is a form of data scaling. The HUSKYLENS camera captures a 320 × 240 pixel image, but the micro:bit display has only a 5 × 5 grid. To display an object’s position, the program scales the larger range of values to fit a smaller one — a process known as mapping. This same idea is used in robotics, game development, and data visualization to translate real-world data into smaller, more useful ranges.
Why the dot moves “backwards.” The micro:bit’s LED grid is arranged with (0, 0) at the top-left corner, while the HUSKYLENS coordinate system uses the bottom-right as its reference point. The mapping equations invert these axes to make the dot move naturally — as if you’re viewing a screen image rather than mirrored camera data.
How it Works
The script begins by importing the cyberbot, i2c_repeat, and huskylens modules.
The i2c_repeat(5, 4).connect() line configures shared I²C communication so the micro:bit can communicate with both the cyber:bot board and the HUSKYLENS camera through pins 5 (SCL) and 4 (SDA).
After a brief sleep(100) delay, initialize_i2c() confirms that the HUSKYLENS is ready, and switch_algorithm("color") puts it into color-recognition mode.
The variable current_id = 1 starts the program tracking color ID 1, and the manage_model("load", current_id) command retrieves the saved color model for that ID from the microSD card.
Inside the while True loop, the script constantly checks for button presses to change the current ID number and for data updates from the camera:
-
Button A increases the ID by 1, wrapping back to 1 after 5.
-
Button B decreases the ID, wrapping back to 5 when it drops below 1.
Each cycle, request_data() asks the HUSKYLENS for its latest detection information.
If is_visible(current_id, "block") returns True, the camera has found a color matching that ID. The script then uses get_frame_value(current_id, "xCenter") and get_frame_value(current_id, "yCenter") to read the X and Y coordinates of the color’s bounding box center.
Those coordinates are mapped from the HUSKYLENS frame size (320×240) to the micro:bit LED grid (5×5). The conversion equations compress the range and invert it so that the LED dot moves like a display cursor rather than a mirrored camera image. The display.set_pixel(x_led, y_led, 9) command lights up the LED corresponding to the detected position. If the object disappears, display.clear() removes the dot.
A small sleep(80) delay smooths out updates and prevents flicker.
Together, these commands turn the HUSKYLENS’s continuous coordinate data into a live, visual representation on the micro:bit’s screen — letting you “see what the camera sees” in simplified form.
Your Turn
The current program plots the center of the color’s bounding box on the micro:bit display.
However, because the center of an object rarely reaches the edges of the HUSKYLENS frame, the LED dot often stops short of the display boundaries.
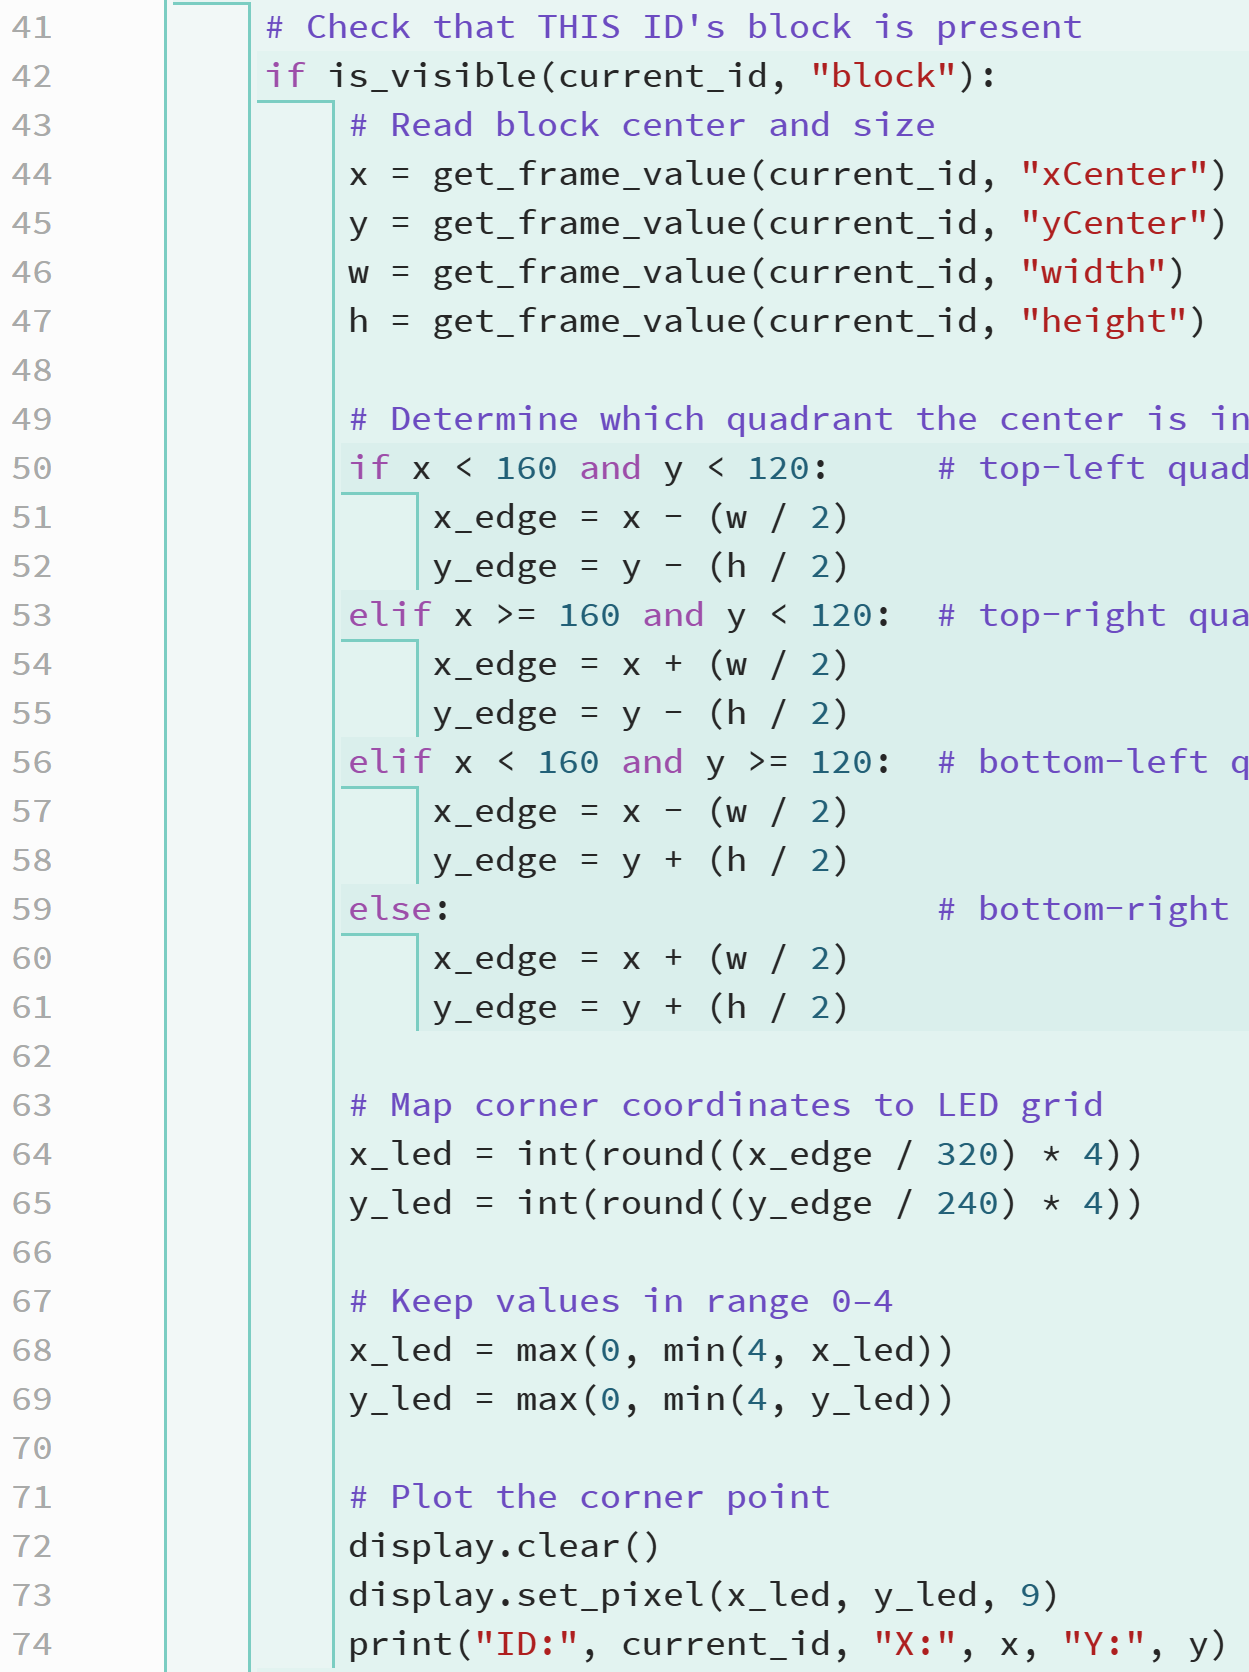
To fix this, you’ll extend the program so it determines which quadrant of the camera’s field of view the color is in, and then plots the corner of the bounding box that’s closest to that corner.
This approach gives a more realistic display of how close the detected color is to the sides of the camera’s view.
The HUSKYLENS provides not only the center position of the detected block (xCenter, yCenter) but also its size (width, height). By checking whether the object’s center is in the top-left, top-right, bottom-left, or bottom-right quadrant of the frame, your program can choose the nearest corner of the bounding box and plot that corner instead.
This ensures that as the object moves toward any edge of the camera’s view, the LED dot can reach the corresponding edge of the micro:bit’s 5×5 grid.
Update Your Script
✓ In your show_object_xy project, locate lines 43–58 — the section that maps coordinates and plots the LED point. It’s the part below if is_visible(current_id, "block"): and above else: display.clear()).
✓ Delete those lines and replace them with the new version below.
✓ This code reads the bounding box dimensions, determines the quadrant, finds the nearest corner, and maps that point to the LED grid.
✓ Repeat your tests, and verify that the outer edges now display object coordinates.
Questions, Exercises, Projects
Questions
-
What is the purpose of the
request_data()function in this program?
It asks the HUSKYLENS to send updated information about detected objects. -
What do the
xCenterandyCentervalues represent? -
Why does the script call
manage_model("load", current_id)before the main loop?
It loads the saved training data from the microSD card so the camera already knows what color to look for. -
What does the line
display.set_pixel(x_led, y_led, 9)do? -
Why is the mapping of coordinates “inverted” in this script?
To make the dot movement on the LED grid match the camera’s display orientation rather than appear mirrored. -
What happens if
is_visible(current_id, "block")returnsFalse?
Exercises
-
Modify the mapping equations so the X and Y values are not inverted.
-
Add an audio indicator using the
tone()function when the dot appears. -
Make the LED brightness vary based on the Y coordinate.
-
Add debug printing to show both the camera coordinates and LED coordinates in the terminal window.
Projects
-
Color Tracker Display
Expand the program to plot multiple colors at once.
Use a loop to check all visible IDs (1–5) and plot each as a different LED brightness or tone.Hint: Use
get_visible_ids()to retrieve all IDs currently seen by the HUSKYLENS, and plot each one usingset_pixel()with varying brightness values. -
Camera Alignment Assistant
Modify the program so that the robot’s wheels turn to center the detected color in the HUSKYLENS frame.
Use the X coordinate to decide whether to turn left or right.Hint: Compare
xto 160 (the horizontal midpoint).-
If
x < 140, turn left usingservo_speed(-20, 20) -
If
x > 180, turn right usingservo_speed(20, -20) -
Otherwise, stop with
servo_speed(0, 0)
-
Solutions
Questions
- What is the purpose of the request_data() function in this program?
It asks the HUSKYLENS to send updated information about detected objects. - Why does the script call manage_model(“load”, current_id) before the main loop?
It loads the saved training data from the microSD card so the camera already knows what color to look for. - Why is the mapping of coordinates “inverted” in this script?
To make the dot movement on the LED grid match the camera’s display orientation rather than appear mirrored.
Exercises
- Modify the mapping equations so the X and Y values are not inverted.
Remove the “4 -” term from both equations and observe how the dot moves in the opposite direction. - Make the LED brightness vary based on the Y coordinate.
Use the value of y_led to set the brightness level in display.set_pixel(x_led, y_led, brightness).
Projects
- Color Tracker Display
Expand the program to plot multiple colors at once.
Use a loop to check all visible IDs (1–5) and plot each as a different LED brightness or tone.