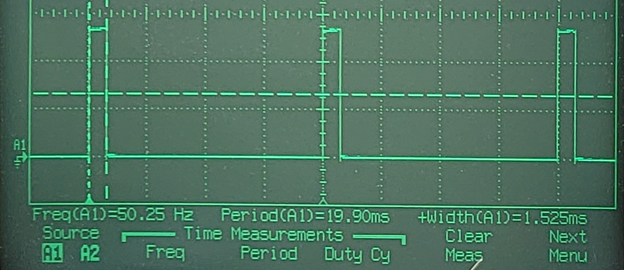
Desktop oscilloscopes have built-in tools to measure period, pulse width, frequency, and much more. You will often see these kinds of measurements along one of the outside edges of the plot.
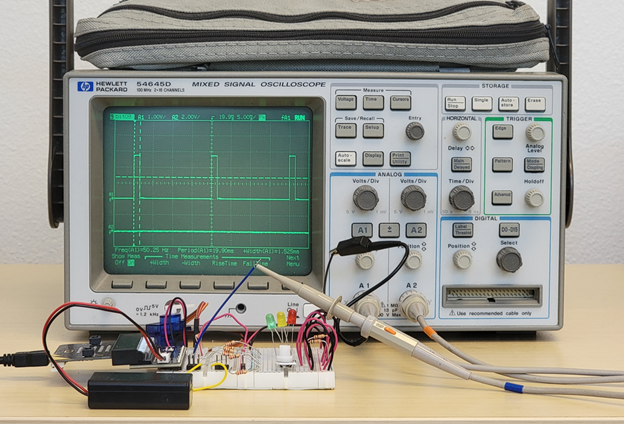
This particular oscilloscope can be configured to display the measurements along the bottom of the plot.
The tests so far have not included 135°, let’s add that to the script and verify the result.

Links
[1] https://docs.google.com/document/d/15auxYUR0YnEvQtKc6jFfm2a4BNcgdhoQRcPrR9eYj_Y/edit#heading=h.ov44fqdkdi74
[2] https://docs.google.com/document/d/15auxYUR0YnEvQtKc6jFfm2a4BNcgdhoQRcPrR9eYj_Y/edit#heading=h.6oak8nsfcryy