Heart Rate Measurement Circuit
In this tutorial, you will learn how to use simple electronic components and craft supplies to build a heart rate measurement sensor. You may be familiar with heart rate/oxygen sensors that clip onto your fingertip. These work by shining a light through your finger and measuring how much light makes it through. When your heart pumps blood out, your blood vessels fill with slightly more blood, which causes them to absorb more light. By using a sensitive light sensor, it is possible to detect and record these changes. The measurements taken by the sensor can then be used to calculate your heart rate.
WARNING: The circuit/device you will build should NOT be used to make medical decisions! Medical grade sensors are rigorously calibrated and designed to produce consistent, accurate, and precise results. The materials used in the projects below, along with the simplified math employed, will result in a device whose accuracy and precision cannot be guaranteed. This project is only designed to teach you how these types of sensors and devices work.
What you’ll need
- (1) Activity Board, Activity Board WX (Item #32912), or Propeller FLiP (Item #32123)
- (1) Red LED
- (1) IR LED
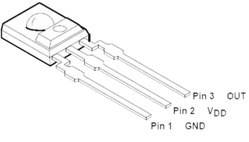
- (1) TSL235R Light-to-frequency sensor (Item #604-00084)
- (2) 220 ohm resistors
- (2) Long 3-pin cables (Item #800-00200)
- (1) Long 3-pin header (2 if using the FLiP)
- Jumper wire
- (2) large popsicle sticks/tongue depressors
- (1) Sheet of 2mm craft foam (this can usually be found near the felt sheets in a craft or big-box store, or purchased from Amazon.com here: https://www.amazon.com/Darice-Foam-Sheet-2mm-Black-pack/dp/B005M2Q9MO)
- Glue - low temp hot glue works best, rubber cement or school glue will work too
- (1) rubber band
Helpful tools
- Single hole-punch
- Scissors
- Hot glue gun (if using hot glue)
WARNING: Hot glue guns can cause serious burns if used improperly! A parent, guardian, or teacher should supervise you while you are using hot glue.
Build the finger-clip sensor circuit
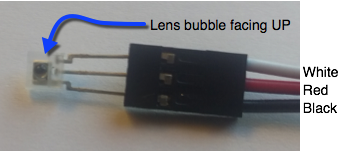
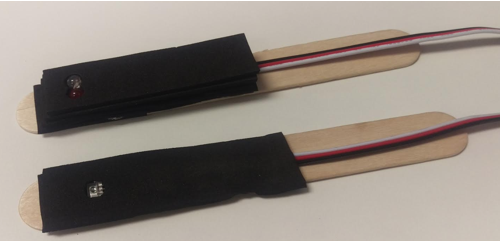
- With the lens bubble facing up, carefully and firmly push the TSL235R Light-to-frequency sensor into one of the 3-pin cables. Be sure to match the pins to the wire colors as shown in the image below:
- Carefully bend the pins on the Red and IR LEDs so they are at a right angle to the bodies of the LEDs. Make sure that when the LEDs are next to each other, the short leads of both LEDs are in the center:
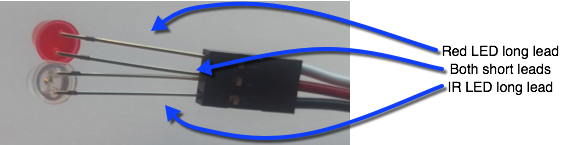
- Carefully and firmly push the LED leads into the other 3-pin cable. Both of the short leads will go into the center pin. Note which wire (white or black) that you plug the Red LED’s long lead into.
- Make sure the Activity Board’s power switch is turned OFF.
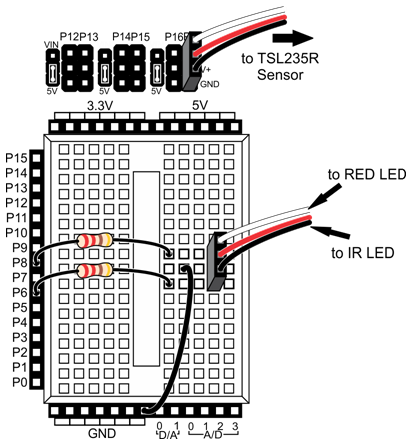
- Build the circuit shown below:
Activity Board:
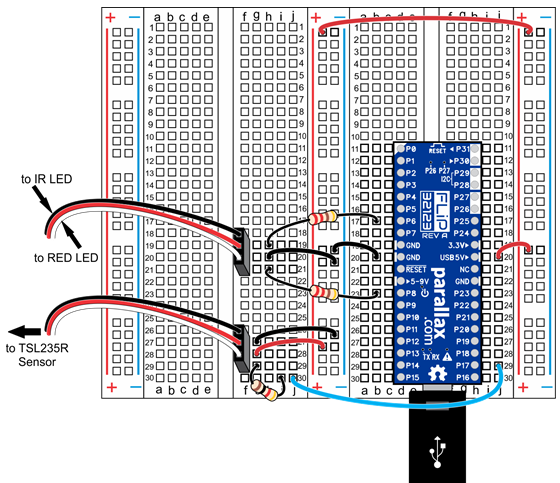
FLiP:
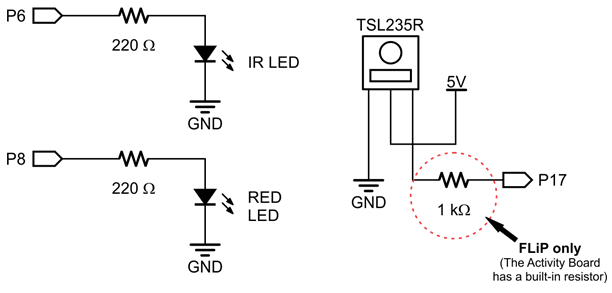
Schematics:
Testing the heart rate sensor circuit
- Create a new BlocklyProp project for the Activity Board or FLiP.
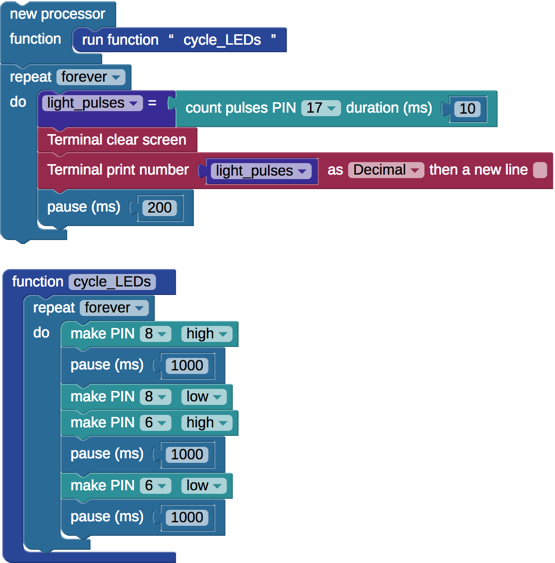
- Build the program shown below:
- [Activity Board] Make sure your Activity Board’s power switch is turned on to position 2.
- Click the “Load to RAM” button.
- Observe the LEDs and the Terminal output on your computer. The program works by turning on the Red LED for 1 second, then the IR LED for 1 second, then both off for 1 second. The Terminal will display the pulse count from the TSL235R sensor. Hold the LEDs over the TSL235R sensor. Observe how the value changes, and use the Terminal output to ensure that both LEDs are working correctly.
- Additionally, observe how much more or less sensitive the TSL235R sensor is to Red versus IR light.
- Make sure the connections are secure. If the connections from the LEDs or sensor to the 3-pin cables seem loose, you may need to put small bends in the leads of the LEDs or TSL235R sensor to improve the connections into the 3-pin cables.
How the test code “reads” the TSL235R sensor
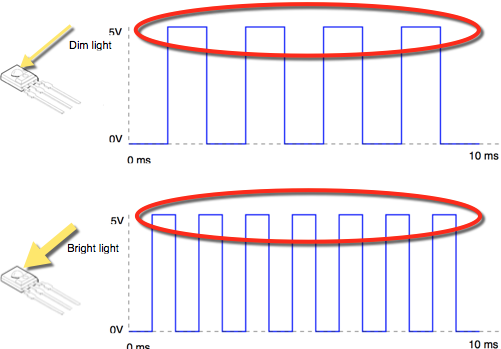
The test program works by counting the number of pulses detected by P17 in 10 ms. The more light the TSL235R detects, the higher the frequency output by the sensor. In other words, the brighter the light that comes through, the more pulses to count in 10 ms.
You can adjust the sensitivity of the sensor by changing the length of time measurements are taken over. Additionally, the TSL235R will be more sensitive to some light frequencies and less sensitive to others. Pretend that the TSL235R is 10 times more sensitive to IR light than Red light. You could measure TSL235R’s output for 10 ms while the IR LED is on, and for 100 ms while the Red LED is on - resulting in both measurements roughly equivalent.
Finish building the finger-clip heart rate sensor
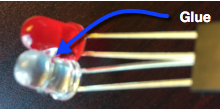
- Use a small amount of glue to hold the two LEDs together:
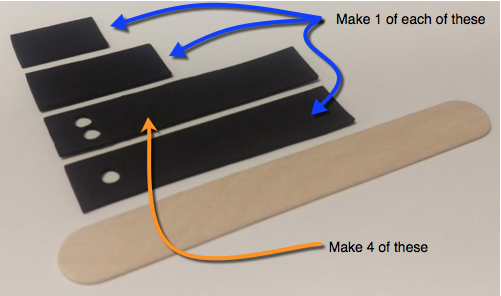
- Cut out 7 strips of craft foam sheet 3 inches long and the width of the popsicle sticks.
- Cut out the following pieces of foam, and use the hole punch or scissors to make the holes you see here:
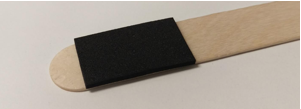
- Glue the 1 inch (2.5 cm) strip onto the end of one of the popsicle sticks:
- Glue the 1.5 inch (4 cm) strip onto the end of the other popsicle stick.
- Place the TSL235R sensor and it’s attached cable onto the 1 inch (2.5 cm) piece of foam, and glue the longer piece with the single hole over it (see picture below).
- Place the two LEDs and their attached cable onto the 1.5 inch (4 cm) piece of foam, and glue the longer pieces with the dual holes over them:
- Face the TSL235R sensor toward the LEDs, and bind the two popsicle sticks with a rubber band as shown below. Make sure the sensor and LEDs are aligned:
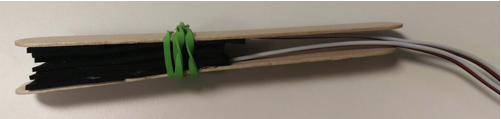
WARNING: Do NOT place the rubber band too close to the sensor/LED end of the finger-clip. If the finger-clip pinches too hard, it will not work as well and could cut off circulation in your finger. You may need to adjust the position of the rubber band to make the sensor more sensitive or consistent.
Use the sensor to measure blood flow changes in your finger
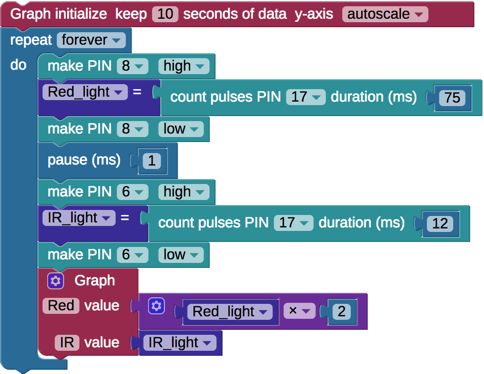
By graphing the output of the light-to-frequency sensor, you’ll be able to “see” how your heartbeat changes the blood flow in your fingertip.
- Build the program below:
- [Activity Board] Make sure you turn your Activity Board’s power switch to position 2.
- Place your index (pointer) finger into the device you built. Make sure the LED’s are shining into your fingernail.
- Load the program to your Activity Board or FLiP.
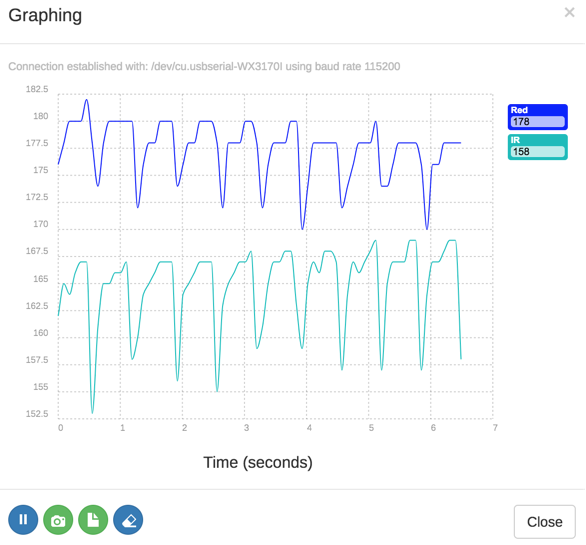
- Observe the graph. You may need to adjust your finger or the rubber band on the device to get a good result:
- You may need to adjust the pulse count duration values to capture blood flow more clearly.
- You may also need to use the “erase” button at the bottom of the graph window to clear the graph, which will re-scale it, making it easier to read.
Did You Know?
By shining the LEDs' light through your finger, you are able to measure how much light your blood absorbs. Modern fitness trackers are so sensitive that they can measure changes in how much light your blood reflects. You may have noticed that newer fitness trackers shine light into your wrist, but there is not a sensor on the other side - that is because the LEDs (usually green and infrared) and the light sensor are on the same small module:
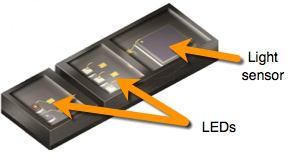 Image of the SFH7060 sensor from Osram Opto Semiconductors
Try this - measure your pulse
Look again at the example graph. By isolating the downward “spikes,” and measuring how far apart they are, it is possible to calculate your pulse. Additionally, the program below will only use the IR LED as it results in a more sensitive measurement.
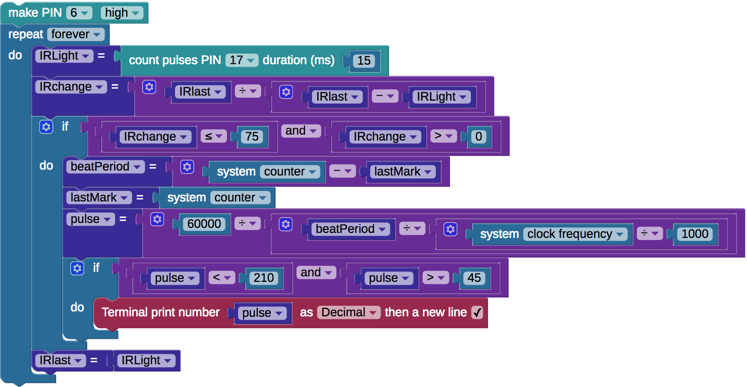
To isolate the downward spikes the program divides the difference between the current and last measurement combined with the last measurement - basically, it looks for a sizeable downward change. When the spike is detected, it stores a timestamp. When there are two timestamps, the difference between them is used to determine your heart rate in beats per minute (BPM).
- Save your last program.
- Open a new project and build the program below:
- [Activity Board] Make sure you set the power switch on your Activity Board to position 2.
- Place your finger in the finger clip sensor with the LEDs shining into your fingernail.
- Load the program to your Activity Board.
- It may take a few seconds for a pulse rate to display in the terminal.
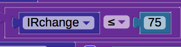
- If a pulse rate does not display, you may need to increase the value of 75 to a larger number like 100 here:
Your turn - Oxygen saturation
When your blood is carrying more oxygen, the difference between the amount of red light your blood absorbs compared to the amount of Infrared light your blood absorbs changes. Using the first program from this activity, observe what happens to the two lines (Red and IR) when you breathe more deeply, hold your breath, exercise, or stay still.