Script: button_led_blink_with_plot
- Right-click button_led_blink_with_plot.hex (below), and choose Save Link As...to download.
button_led_blink_with_plot.hex
- Click the micro:bit Python Editor's Open button, then select and open button_led_blink_with_plot.hex.
- Click Send to micro:bit.
- Click the three vertical dots ⋮ by the Send to micro:bit button, and select Disconnect.
- Start the CYBERscope:
- In a different browser tab, go to cyberscope.parallax.com.
- Click the CYBERscope's Connect button.
- In the serial port dialog, select the port with mbed in its name, and then click Connect.
Tests
- Wait until the plotted dots reach (or wrap back around to) somewhere in the 2k to 4k range.
- Press and hold the pushbutton for about six blinks.
- Verify that your plot resembles this.
NOTE: Before the first pushbutton press, you might notice the red Ch2 voltage trace is plotting irregularly in the 0.5 to 1.5 V range. That’s because the LED pin is a floating input that has not been set to low or high by pin13.write_digital(0) or pin13.write_digital(1).
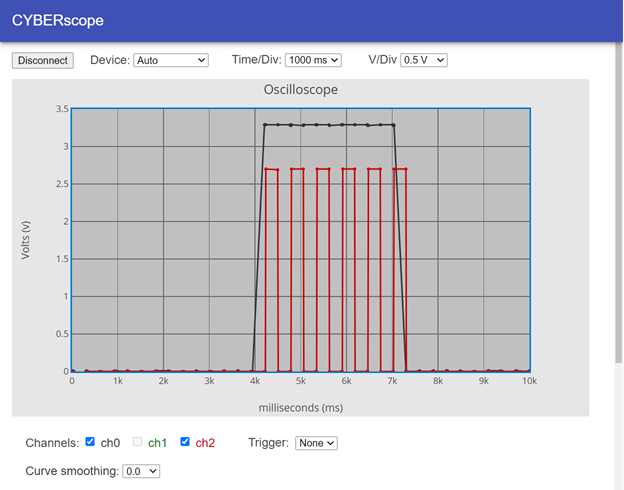
Also verify the following:
- While the button is not held down:
- The black ch0 trace connected to the pushbutton should repeatedly plot points close to 0 V along the bottom of the plot area.
- The red ch2 trace connected to the LED should also plot points close to 0 V along the bottom of the plot.
- While the button is held down:
- The black ch0 trace should plot points at around 3.3 V.
- The red ch2 trace should plot the on signals in the 2.5 to 3.3 V neighborhood, and off signals at 0 V, should continue to repeat while the button is pressed and held down.
- In the CYBERscope, click Disconnect.