Did You Know: Desktop Oscilloscopes
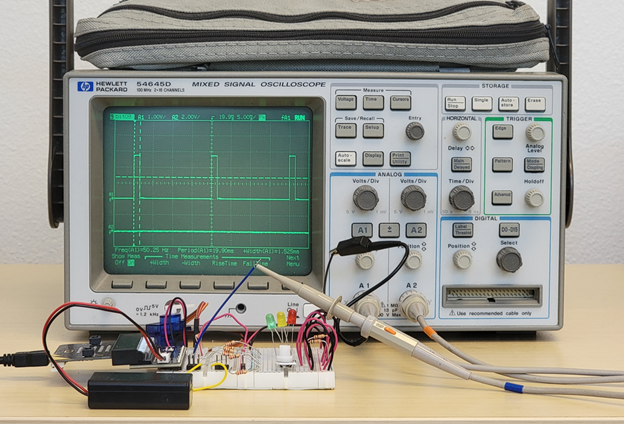
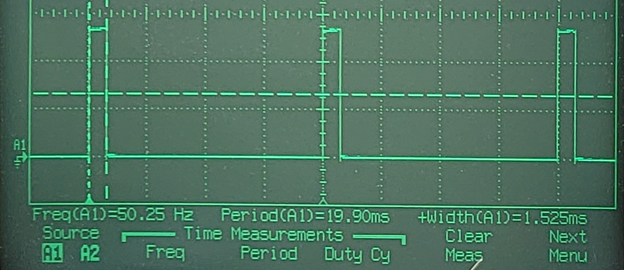
Desktop oscilloscopes have built-in tools to measure period, pulse width, frequency, and much more. You will often see these kinds of measurements along one of the outside edges of the plot.

This particular oscilloscope can be configured to display the measurements along the bottom of the plot.
- Locate the Freq(A1), Period(A1) and _+Width(A1) measurements in the picture.

Your Turn
The tests so far have not included 135°, let’s add that to the script and verify the result.
- Analyze the pulse width information you have gathered so far, and use it to predict the pulse width that will make the servo turn to 135°.
- Find the formula for calculating duty cycle if angle is known in the Connect and Test the Servo activity’s Did You Know page.
- Use it to calculate the duty cycle for positioning the servo horn at 135°.
- Add a pin16.write_analog statement to make the servo horn turn to 135°.
- Add a plot statement to make the CYBERscope’s oscilloscope view display the pulse.
- Add a sleep statement to make the servo hold its position for four seconds.
