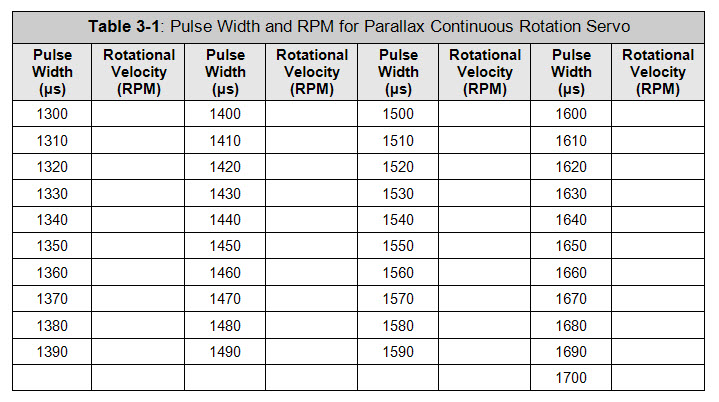
You can use the table below to record the data for your own transfer curve. The TestServoSpeed sketch’s loop can be modified to test every value in the table, or every other value to save time.
- Click the "Printer-friendly version" link at the bottom-right of this page and print out the graph.
- Change the for statement in TestServoSpeed from:
for(int pulseWidth=1375; pulseWidth <= 1625; pulseWidth += 25)
…to:
for(int pulseWidth=1300; pulseWidth <= 1700; pulseWidth += 20)
- Load the modified sketch into the Arduino and use it to fill in every other table entry. (If you want to fill in every table entry, use pulseWidth += 10 in the for statement’s increment parameter.)
- Use graphing software of your choice to plot the pulse width vs. wheel RPM.
- To repeat these measurements for the right wheel, replace all instances of 13 with 12 in the sketch.

