When light levels are low, the rcTime function might take time measurements too large for int or even word variables to store. The next step up in storage capacity is a long variable, which can store values from -2,147,483,648 to 2,147,483,647. So, the function definition long rcTime(int pin) is set up to make the function return a long value when it’s done. It also needs to know which pin to measure.
long rcTime(int pin)
A charge transfer measurement takes seven steps: (1) Set the I/O pin high to charge the capacitor. (2) Wait long enough for the capacitor to charge. (3) Change the I/O pin to input. (4) Check the time. (5) Wait for the voltage to decay and pass below the Arduino’s 2.1 V threshold. (6) Check the time again. (7) Subtract the step-3 time from the step-6 time. That’s the amount of time the decay took.
{
  pinMode(pin, OUTPUT);         // Step 1, part 1
  digitalWrite(pin, HIGH);      // Step 1, part 2
  delay(1);                     // Step 2
  pinMode(pin, INPUT);          // Step 3  part 1
  digitalWrite(pin, LOW);       // Step 3, part 2
  long time  = micros();        // Step 4
  while(digitalRead(pin));      // Step 5
  time = micros() - time;       // Step 6 & 7
  return time;
}
In this sketch, Step 1 has two sub-steps. First, pinMode(pin, OUPUT) sets the I/O pin to an output, then digitalWrite(pin, HIGH) makes it supply 5 V to the circuit. Step 3 also has two sub-steps, because the I/O pin is sending a high signal. When the sketch changes the I/O pin’s direction from output-high to input, it adds 10 kΩ of resistance to the circuit, which must be removed. Adding digitalWrite(pin, LOW) after pinMode(pin, INPUT) removes that resistance and allows the capacitor to drain its charge normally through the phototransistor.
Optional Advanced Topic: Voltage Decay Graphs
The graph below shows the BOE Shield-Bot’s left and right QT circuit voltage responses while the BothLightSensors sketch is running. The device that measures and graphs these voltage responses over time is called an oscilloscope. The two lines that graph the two voltage signals are called traces. The voltage scale for the upper trace is along the left, and the voltage scale for the lower trace is along the right. The time scale for both traces is along the bottom. Labels above each trace show when each command in BothLightSensors executes, so that you can see how the voltage signals respond.
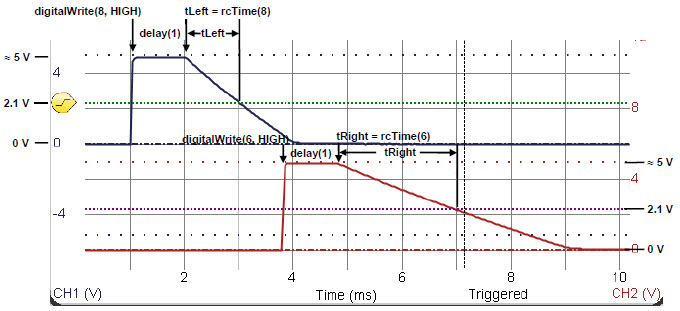
The upper trace in the graph plots the capacitor’s voltage in the pin 8 QT circuit; that’s the left light sensor. In response to digitalWrite(8, HIGH), the voltage quickly rises from 0 V to almost 5 V at about the 1 ms mark. The signal stays at around 5 V for the duration of delay(1). Then, at the 2 ms mark, the rcTime call causes the decay to start. The rcTime function measures the time it takes the voltage to decay to about 2.1 V and stores it in the tLeft variable. In the plot, it looks like that decay took about 1 ms, so the tLeft variable should store a value close to 1000.
The lower trace in the graph plots the pin 6 QT circuit’s capacitor voltage—the right light sensor. This measurement starts after the left sensor measurement is done. The voltage varies in a manner similar to the upper trace, except the decay time takes about 2 ms. We would expect to see tRight store a value in the 2000 neighborhood. This larger value corresponds to a slower decay, which in turn corresponds to a lower light level.